

Equities and Bonds Rally, Oil Declines in Q2
In the second quarter, global equity and credit markets rebounded from first-quarter weakness as the U.S.-Iran conflict transitioned into a series of intermittent ceasefires and ongoing attempts at de-escalation. President Trump’s initial ceasefire announcement on April 7sparked a risk-on environment that persisted throughout the quarter.
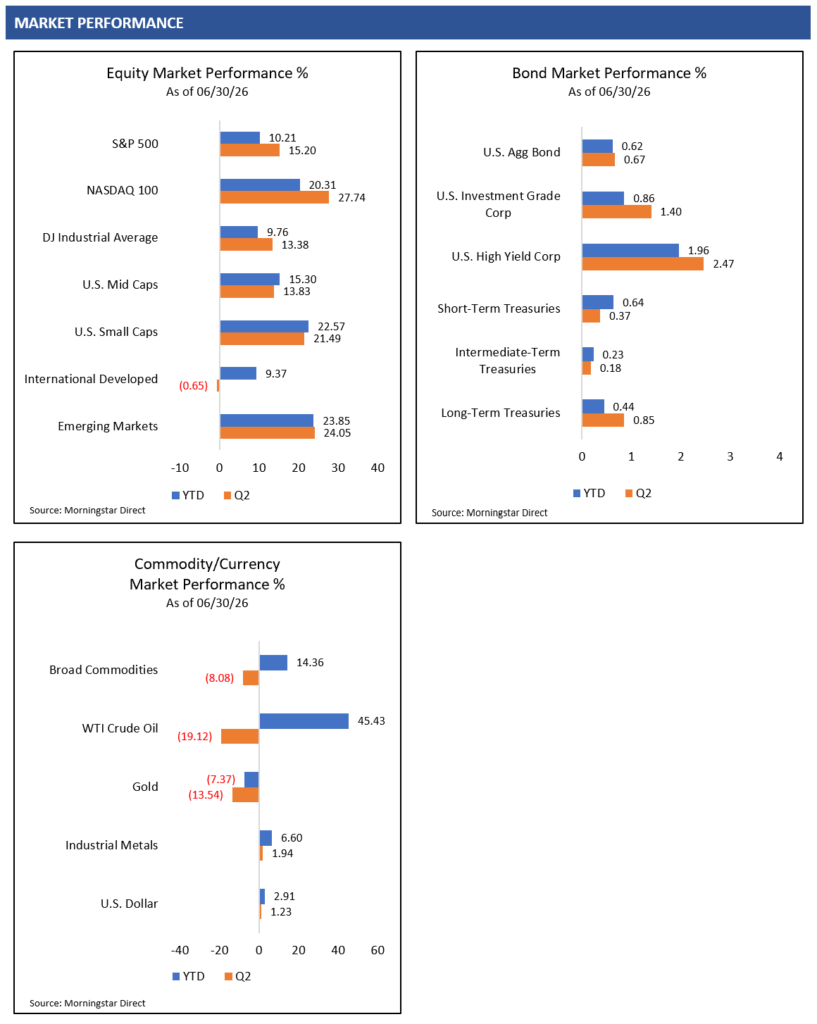
In Q2, the S&P 500 Index rallied 15.20%, while the technology-heavy NASDAQ 100 Index posted a 27.74% gain.1 Investors continued to show their appetite for investments related to artificial intelligence, propelling AI-related stocks significantly higher in the quarter.
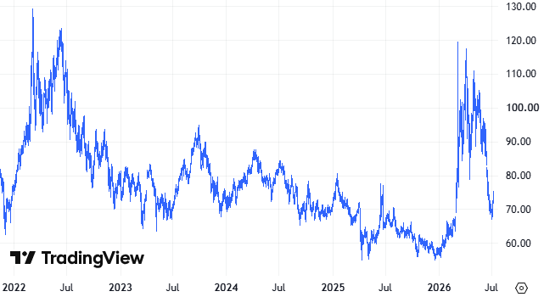
With the potential for de-escalation in the Middle East, energy prices have declined significantly from their recent peaks as the worst fears of supply disruption have eased. West Texas Intermediate crude oil fell from a high of approximately $120 per barrel in early March to below $70 per barrel in late June, but the situation remains fragile.
This steep drop in energy prices served as a catalyst for the broader financial markets. Cheaper oil can directly translate to lower transportation and input costs for businesses while providing relief to consumers at the gas pump. This easing of lingering inflationary pressures helped push interest rates lower from their highs and added to the bullishness in equities. For the time being, investors may remain focused on the underlying strength of the global economy and corporate fundamentals.
Economic Stability but Inflation Pressures Persist
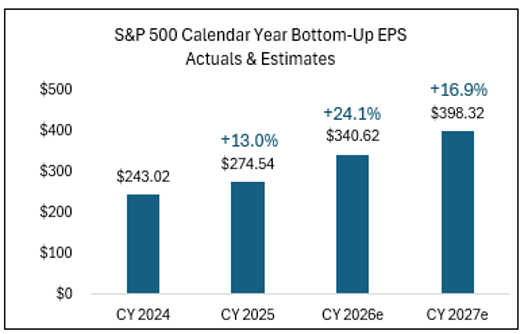
From a fundamental perspective, a resilient U.S. economy paired with strong corporate earnings growth continues to support bullish momentum in equities. According to FactSet, analysts project over 20% year-over-year earnings growth for the S&P 500 Index this year and continued growth into 2027.2
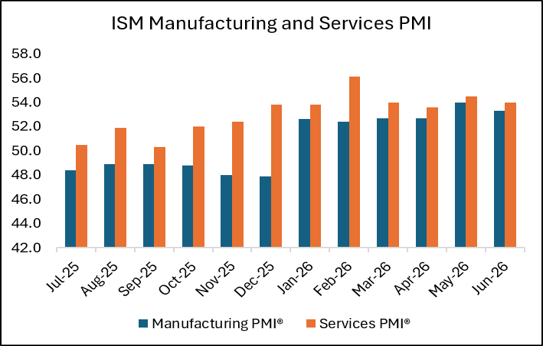
Recent macroeconomic data shows resilience in the U.S. economy. Based on the June 2026 Purchasing Managers’ Index reports from the Institute for Supply Management, both the U.S. manufacturing and services sectors remain in expansion territory, with readings of 53.3 and 54.0, respectively. A PMI reading above 50 indicates economic growth. A stable economy could provide a solid foundation for corporate fundamentals, and investors could continue to support equity and credit markets accordingly.
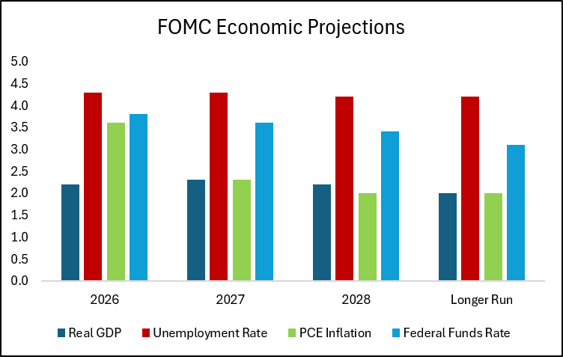
The U.S. economy and labor market are anticipated to remain supportive, but inflation is currently hovering above the Federal Reserve’s long-term target of 2%. The recent spike in energy prices, combined with heavy capital expenditures and demand tied to the artificial intelligence infrastructure buildout, suggests that inflationary pressures could stay for longer than anticipated. This may lead the Federal Reserve to maintain a tighter monetary policy for longer.
New Fed Chairman and a Hawkish Tilt
Recent commentary from new Federal Reserve Chairman Kevin Warsh and other Fed governors indicates a potentially hawkish tilt and a desire to manage monetary policy to keep inflation in check. This leaves the door open for a potential rate hike rather than the series of rate cuts that market participants widely anticipated at the beginning of the year.
Chairman Warsh appears to favor a communication style that provides fewer explicit insights and less forward guidance than what investors grew accustomed to under his predecessor, Jerome Powell. By reducing this transparency, Chairman Warsh may be introducing an environment where market participants need to rely more on raw data rather than explicit central bank guidance. This structural shift in communication could result in higher uncertainty and more volatility in the bond markets.
Inflation has remained stubbornly sticky. The Personal Consumption Expenditures (PCE) price index excluding food and energy (Core PCE), serves as a key inflation metric for the Federal Reserve because it strips out volatile energy and food components to reveal long-term pricing trends. The May 2026 Core PCE Index reading showed an increase of 3.4% year-over-year, continuing an upward trend over the last few months. The broader Consumer Price Index for May, which does include food and energy costs, jumped to 4.2% on a year-over-year basis. Both measures remain above the preferred 2% long-term inflation target set by the Federal Reserve.
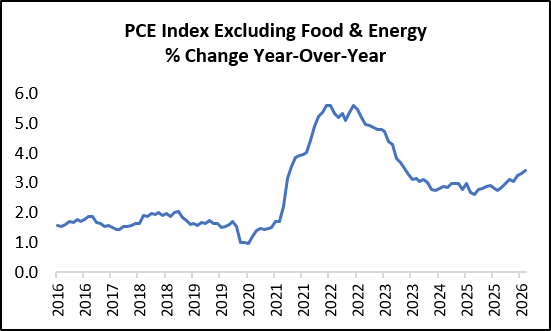
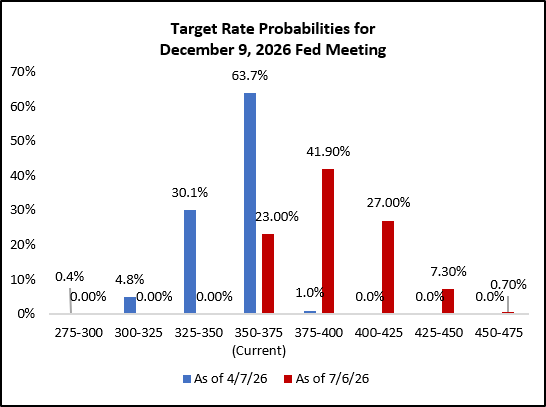
This persistent pricing pressure may ultimately force the Federal Reserve to either maintain the current federal funds rate target range of 3.50% to 3.75% or implement an additional rate hike to reduce inflation pressures. As it currently stands, the federal funds futures market is pricing in at least one rate hike before the end of the year. This is a significant reversal from the market narrative in early April, when investors were still pricing in a Fed rate cut.
Looking Ahead to the Second Half
It has been a strong start to the year for equity and bond investors, but macroeconomic uncertainties remain. The U.S.-Iran conflict has not been fully resolved. Questions regarding the return on investment for artificial intelligence initiatives are being raised. A potentially less transparent Federal Reserve under new Chairman Kevin Warsh and the upcoming U.S. midterm elections are key political factors investors will need to navigate.
If economic and corporate strength persists and investors can look past these short-term market uncertainties, they could continue to be rewarded as we move through the second half of the year.
Q2 Market Review
Equity Markets
Following the equity market weakness in Q1 from the U.S.-Iran conflict, U.S. equity markets rallied in Q2 as investors were optimistic that the U.S.-Iran conflict could be contained.
The S&P 500 Index rebounded 15.20% and the NASDAQ 100 Index rallied 27.74% in Q2. Investors continued to aggressively support AI infrastructure-related companies in semiconductors, memory and networking businesses, pushing these companies’ stock prices significantly higher. Small cap stocks, which can have higher sensitivity to the U.S. economy and are often favored by momentum traders, performed very well in Q2, with the Russell 2000 Index up 21.41% in the quarter.
YTD Performance (as of 6/30/26)
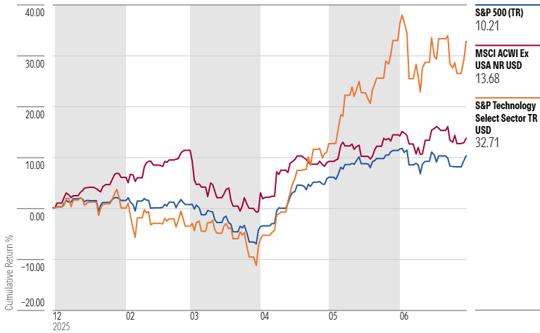
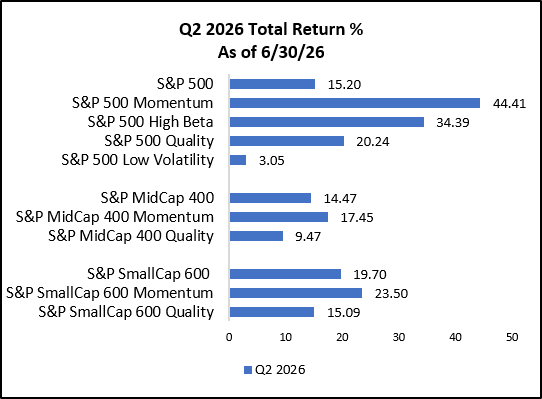
High-momentum and high-beta stocks significantly outperformed in Q2. It remains to be seen whether this speculative and momentum-driven market environment will persist, or if parts of the equity market have overshot their fundamental potential over the short term.
International markets were mixed in Q2. The MSCI EAFE Index, measuring foreign developed equity markets, was slightly negative at -0.65% in the quarter. The MSCI Emerging Markets Index, which has quickly become concentrated in AI-related semiconductor and memory companies in Asia, rallied 24.05% in the quarter.1
Global economic and corporate fundamentals still appear solid. Equity valuations remain elevated relative to history, but strong underlying earnings growth has kept price-to-earnings multiples from eclipsing recent highs. This setup may be enough for investors to continue to support global equities to higher levels.
Bond Markets
U.S. bonds delivered generally positive results in the second quarter. Treasury yields were volatile and shifted slightly higher throughout the quarter as inflation remained stubbornly persistent. This caused investors to start considering the potential for the Federal Reserve to raise the federal funds rate, which resulted in the Treasury yield curve shifting higher.
During the second quarter, the U.S. 10-year Treasury yield reached a high of roughly 4.67% before ending the quarter at 4.44%. The longer-term 30-year Treasury yield closed the quarter at 4.91%.8 Although rising interest rates initially pressured bond valuations during the quarter, bond income generation helped to protect total return.
At the start of Q2, credit spreads had widened due to rising geopolitical tensions between the U.S. and Iran. As investors started to believe that the conflict could be somewhat contained, demand for riskier corporate debt increased, and credit spreads tightened. A resilient macroeconomic environment and solid corporate earnings growth also provided a strong fundamental backdrop for underlying corporate credit markets.
Looking at broader bond market performance, the investment-grade-focused Bloomberg U.S. Aggregate Bond Index returned 0.67% in Q2. The more credit-sensitive and volatile Bloomberg High-Yield Bond Index returned 2.47%. This high-yield bond performance marked a strong rebound from the credit weakness experienced earlier in the year.
Interest rates have maintained their recent higher levels, and credit spreads remain tight relative to historical averages. For now, bond investors may be positioning for income generation rather than anticipating capital appreciation from falling interest rates and credit spread tightening.
Commodity Markets
The potential easing of geopolitical tensions between the U.S. and Iran has resulted in significant price reversals in both oil and precious metals in Q2.
The unpredictable nature of ongoing negotiations between the U.S. and Iran has created significant volatility within global energy markets. At the beginning of this geopolitical conflict, West Texas Intermediate crude oil prices experienced a price spike from the low $50 per barrel range to roughly $120 per barrel in March. Since then, there has been a series of negotiations and on-again, off-again ceasefires taking place.
Over the last few months, investors have attempted to look past the immediate geopolitical uncertainties. Market participants are increasingly assuming that both the U.S. and Iran ultimately want to reach an agreement to prevent severe oil supply constraints and avoid further price shocks. This shift in market psychology has caused oil to trend significantly lower, falling below $70 per barrel in late June, driven by the belief that oil supplies will come back online in the near future.
While questions remain regarding the ultimate resolution of the U.S.-Iran conflict and whether full oil production can be sustained to meet global demand, investors will need to keep a close eye on declining oil storage levels. Investors will need to see if global supply chains can return to their previous capacity and whether balance can return to the global energy markets.
WTI Crude Oil Price
In our previous quarterly commentaries, we expressed concern that gold and silver prices may have been trading largely on short-term price momentum and speculation. We suggested that a cautious approach to gold and silver might be warranted.
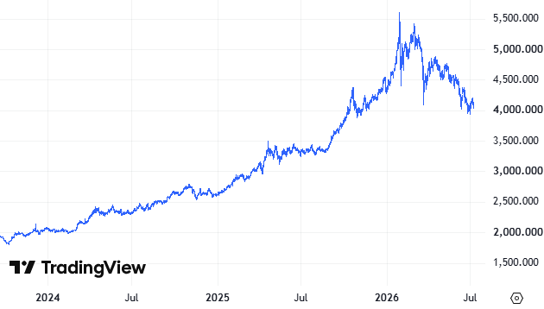
Gold experienced extreme volatility throughout the first and second quarters as the significant upward price momentum from last year eventually faded. From its high of almost $5,600 per ounce reached in late January of this year, gold quickly declined almost 30% as it fell below $4,000 an ounce. It has since bounced from that level. Gold investors will need to be able to navigate what appears to be an increasingly volatile, momentum-driven market environment.
Gold Price
Currency Markets
The U.S. dollar has shown some strength this year. The U.S. Dollar Index rallied 1.23% in Q2 and is up 2.91% for the year.1 The U.S. dollar historically acts as a “safe haven” asset during periods of elevated geopolitical uncertainty. The risks tied to the U.S.-Iran conflict may have provided support for the U.S. dollar this year.
The U.S. economy remains fundamentally strong, which can attract foreign capital to U.S. assets, particularly with the added excitement driven by U.S. artificial intelligence-related companies. Sticky inflation in the U.S. has also led bond markets to price in the potential for higher interest rates for longer. This combination of solid economic growth and higher bond yields relative to other developed countries could continue to drive support for the U.S. dollar.
SOURCES
- Morningstar Direct. Performance provided as total returns. U.S. Mid Caps is defined by the Russell Mid Cap TR USD index. U.S. Small Caps is defined by the Russell 2000 TR USD index. U.S. Growth is defined by the Russell 3000 Growth TR USD index. U.S. Value is defined by the Russell 3000 Value TR USD index. International Developed is defined by the MSCI EAFE NR USD index. Emerging Markets is defined by the MSCI Emerging Markets NR USD index. U.S. Agg Bond is defined by the Bloomberg U.S. Aggregate Bond TR USD index. U.S. Investment Grade Corp is defined by the Bloomberg U.S. IG Corp USD 300 M TR USD Index. U.S. High Yield is defined by the Bloomberg High Yield Corporate TR USD index. Broad Commodities is defined by the Bloomberg Commodity TR USD index. WTI Crude Oil is defined by the Bloomberg Sub WTI Crude Oil TR USD Index. Gold is defined by the Bloomberg Sub Gold TR USD Index. Industrial Metals is defined by the Bloomberg Sub Industrial Metals TR USD Index. Short-Term Treasuries defined by the Bloomberg 1-3 Yr U.S. Treasury TR USD index. Intermediate-Term Treasuries defined by the Bloomberg Intermediate U.S. Treasury TR USD Index. Long-Term Treasuries defined by the Bloomberg Long-Term U.S. Treasury TR USD Index.
- FactSet. Earnings Insight. 7/2/26.
- Federal Open Market Committee. Summary of Economic Projections June 17, 2026 https://www.federalreserve.gov/monetarypolicy/fomcprojtabl20260617.htm
- Institute for Supply Management. June 2026 ISM® Manufacturing PMI® Report https://www.ismworld.org/supply-management-news-and-reports/reports/ism-pmi-reports/pmi/june/
- Institute for Supply Management. June 2026 ISM® Services PMI® Report https://www.ismworld.org/supply-management-news-and-reports/reports/ism-pmi-reports/services/june/
- U.S. Bureau of Economic Analysis, Personal Consumption Expenditures Excluding Food and Energy (Chain-Type Price Index) [PCEPILFE], retrieved from FRED, Federal Reserve Bank of St. Louis; https://fred.stlouisfed.org/series/PCEPILFE, July 6, 2026.U.S. Bureau of Labor Statistics, All Employees, Total Nonfarm [PAYEMS], retrieved from FRED, Federal Reserve Bank of St. Louis; https://fred.stlouisfed.org/series/PAYEMS, April 6, 2026.
- CME Group. FedWatch Tool. Retrieved 4/8/26 and 7/6/26 fromhttps://www.cmegroup.com/markets/interest-rates/cme-fedwatch-tool.html
- U.S. Treasury. Daily Treasury Par Yield Curve Rates https://home.treasury.gov/resource-center/data-chart-center/interest-rates/TextView?type=daily_treasury_bill_rates&field_tdr_date_value=2026
- TradingView.com. WTI Crude Oil. Retrieved 7/8/26 from https://www.tradingview.com/chart/S5oI8Odc/?symbol=TVC%3AUSOIL
- TradingView.com. Gold. Retrieved 7/8/26 from https://www.tradingview.com/chart/S5oI8Odc/?symbol=TVC%3AGOLD

Investment Consultant | Portfolio Manager | Wealth Advisor
Eric is a member of the Larson Financial investment committee and provides private wealth management services through Intrua Financial.
A passionate advocate for financial literacy, Eric also develops multimedia educational courses and market insights designed to demystify complex investment concepts for individual investors.
Prior to his current roles, Eric served as a Senior Portfolio Analyst and Vice President at Robert W. Baird, and previously as a Mutual Fund Specialist at U.S. Bancorp Fund Services.
He is a CFA® charterholder and a CERTIFIED FINANCIAL PLANNER™ professional. Eric earned his Master of Business Administration with a specialization in Finance from Marquette University, graduating with honors, and holds a Bachelor of Business Administration from the University of Wisconsin–Madison.