
Iran Conflict Drives Asset Volatility in Q1
The initial outlook for the year reflected a sense of optimism as investors anticipated moderate U.S. economic growth alongside strong corporate earnings and global stability. This environment resulted in a continued rally in global equities, where cyclical sectors performed well and market participation began to broaden beyond artificial intelligence-related companies and momentum-based speculative trades. That positive narrative faced an abrupt shift in March when the U.S. and Israel began military actions against Iran.
The immediate market reaction followed a classic risk-off pattern driven by a sudden spike in energy costs. Crude oil prices surged, forcing a quick repricing of inflation expectations. This caused interest rates to climb and the U.S. dollar to strengthen, while global stocks and precious metals entered correction territory.
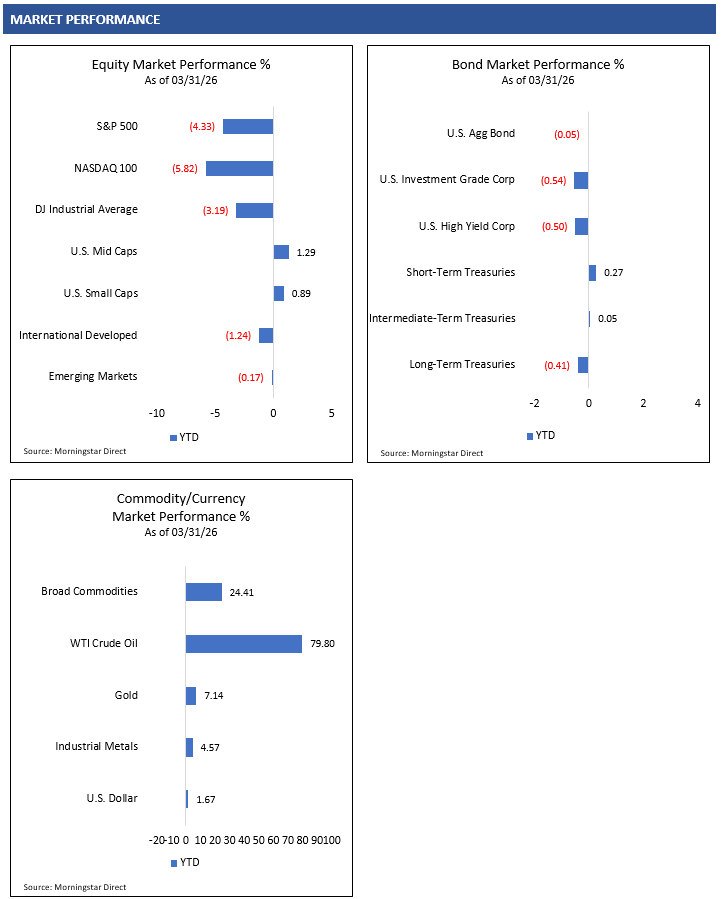
While the quarterly performance figures provide a snapshot of the period, they mask the volatility that occurred in March. For the first quarter, the S&P 500 Index lost 4.3%, while the technology-heavy NASDAQ 100 Index fell 5.8% and the Dow Jones Industrial Average Index saw a 3.2% decrease.1
Bond markets remained somewhat more resilient, as the Barclays US Aggregate Bond Index stayed nearly flat and the Bloomberg High Yield Corporate Bond Index declined only 0.5% for the quarter. WTI Crude Oil finished the quarter with a massive 79.8% gain, which served as a primary headwind for equity performance. Gold managed to end the quarter up 7.1% despite a sharp retracement from its prior high. 1
The Trump administration characterized its military operations in Iran as a targeted effort rather than the start of a prolonged conflict. Following a high-stakes ultimatum issued to Iran, President Trump announced an agreement on April 7 for a two-week ceasefire. This pause is intended to allow the U.S. and Iran to negotiate an end to the conflict. The announcement triggered a decline in oil prices and interest rates, while sparking a broad rally across global equities, bonds and precious metals.
Time will tell whether this ceasefire can translate into longer-term de-escalation and a reduction in geopolitical risk across the Middle East. If so, investors can shift back to focusing on economic and corporate fundamentals.
Economic Headwinds from Geopolitical and Energy Shocks
Until the geopolitical risk in the Middle East subsides, financial markets could continue to struggle with the inflationary pressure of WTI Crude Oil trading over $100 per barrel. This represents a substantial surge from the mid-$50s range where oil was priced prior to the recent conflict in Iran. This massive price spike essentially acts like a tax on consumers and could compress business profit margins. If oil prices remain elevated for an extended period, investors may need to pivot away from the original 2026 narrative of solid global growth and prepare for a potentially weaker macroeconomic environment.
To reduce this potential risk and limit lingering economic damage, U.S. and OPEC+ oil and gas producers must find ways to increase supply, or the conflict will need to reach a quick resolution. Because macroeconomic data is inherently backward-looking, the official statistical impact of these higher energy costs on inflation metrics and Gross Domestic Product may not be visible for several months.
If the current ceasefire translates into lower geopolitical risk across the Middle East, with United States objectives met and energy markets returning to historical norms, the damage to the global economy could be limited.
Trade Policy and Midterm Elections Remain an Overhang
Trade policy took a new turn in February when the Supreme Court ruled that President Trump could not use the International Emergency Economic Powers Act (IEEPA) to impose tariffs on other nations. Following that ruling, the Trump administration leveraged executive powers under Section 122 of the Trade Act of 1974 to impose a 10% global tariff for 150 days, noting the potential for that rate to increase to 15%. This ongoing tariff policy uncertainty may be difficult for corporate management teams to navigate. Without clear forward guidance on global supply chain costs, business capital expenditures and overall economic activity could remain suppressed compared to an environment with clearer trade policies.
The November midterm elections continue to act as an overhang of uncertainty because fiscal and regulatory policies may shift if control in Washington changes hands. Current polling suggests Democrats are leading the race to retake the majority in the House of Representatives, while Republicans are maintaining their lead in the Senate. We are still several months away from voting day, and investors may need to wait for the actual results before committing to a definitive investment strategy.
Paying Close Attention to Earnings Season
The passage of the One Big Beautiful Bill Act last year created an attractive tax environment for businesses. This favorable tax structure remains a fundamental backdrop supporting the broader U.S. economy and corporate profitability.
As we enter the current earnings season, investors will be focused on forward guidance from corporate management teams. Investors need to understand how companies are navigating the headwinds of higher energy costs and ongoing tariff uncertainty. There is also a lot of interest in how artificial intelligence investments are driving capital expenditures and whether those heavy upfront costs will translate into measurable productivity enhancements.
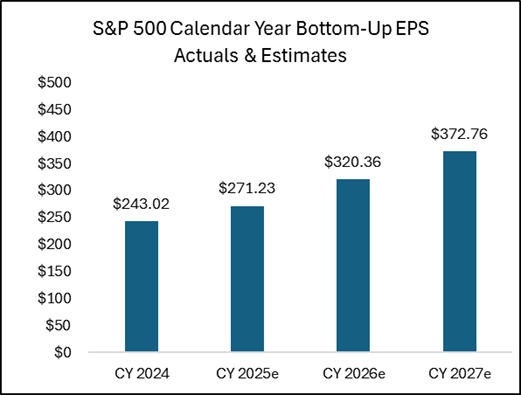
Despite the recent macroeconomic challenges, current consensus estimates for the S&P 500 Index remain relatively optimistic. According to FactSet, analysts estimate that the aggregate companies within the index could deliver continued earnings growth throughout 2026 and into 2027.2 If corporate earnings can meet or exceed these expectations, it could provide the necessary underlying support for equity markets to stabilize and build a foundation for the next leg higher.
S&P 500 Index Earnings
Fed Rate Policy on Hold for Now
At the Federal Open Market Committee meeting in March, the Federal Reserve voted to leave the federal funds rate unchanged at a target range of 3.50% to 3.75%. Looking ahead, monetary policy may see a shift in leadership. President Trump has nominated Kevin Warsh to take over the Federal Reserve Chairman position from Jerome Powell when Powell’s current term expires in May.
There is a belief among some market participants that Warsh could be supportive of lower federal funds rates but less inclined to expand the Fed’s balance sheet as a tool to manipulate longer-term interest rates. It is crucial for investors to remember that the Chairman cannot dictate interest rates unilaterally. Warsh will need to build a consensus and secure the support of other voting members on the committee to enact any major monetary policy changes.
The recent spike in energy markets tied to the conflict in Iran complicates the economic outlook for the Fed. It remains highly uncertain whether these surging energy costs will seep into the broader economy and create secondary inflationary pressures across various goods and services. If these rising input costs cause overall inflation to remain stubbornly above the Fed’s official 2% target, policymakers may be forced to keep any anticipated rate cuts on hold.
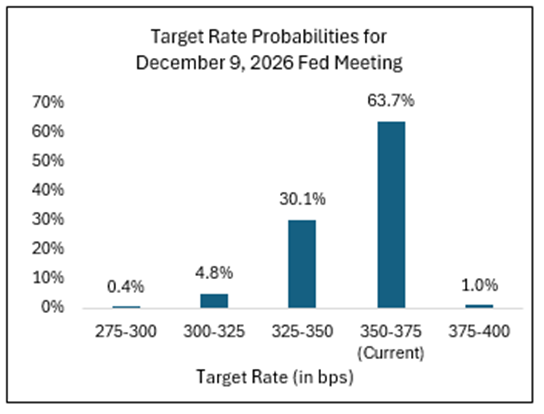
Federal funds futures currently reflect a potentially cautious Fed. According to the CME FedWatch Tool as of April 8, 2026, the market is pricing in a moderate probability of one additional rate cut this year. The highest probability (63.7%) outcome currently priced into financial markets is that the Fed remains on pause through the rest of the year.3 This suggests that interest rates could stay at their current levels until the situation in Iran stabilizes and inflation data shows a definitive downward trend.
Fed Funds Rate Probabilities
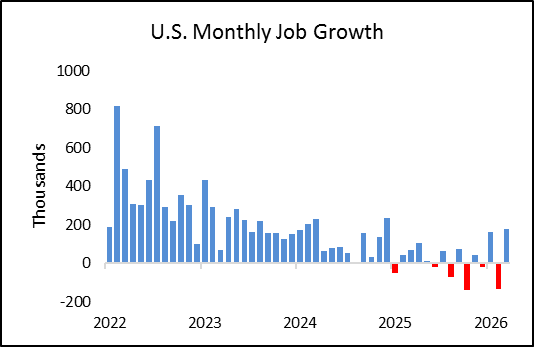
U.S. job growth has been inconsistent over the past twelve months. Nonfarm payrolls increased by 178,000 in March, a strong recovery from the 133,000 jobs lost during February. The unemployment rate decreased to 4.3% and remains at the lower bound of its historical range. The U.S. economy appears to remain in a low-hire and low-fire environment.
The Federal Reserve will need to evaluate the health of the workforce and balance it with a potentially stickier inflationary environment than preferred.
Q1 Market Review
Equity Markets
Global equity markets experienced extreme volatility throughout the first quarter. Both U.S. and international equity indices started the year on a solid path higher. This early rally was driven by cyclical sectors and a resurgence in domestic mid cap and small cap stocks. Investors hoped the long-awaited expansion in market breadth had finally arrived and that performance might no longer be heavily concentrated in artificial intelligence-related companies or other highly speculative areas of the market.
That optimistic sentiment shifted quickly when the United States and Israel launched military operations targeting Iranian military infrastructure. As energy markets spiked in response to the geopolitical threat, global equities sharply declined as investors aggressively sought safe-haven assets. From their recent highs, the S&P 500 Index declined approximately 10%, the technology-heavy NASDAQ 100 Index dropped roughly 13%, and the Dow Jones Industrial Average fell approximately 11%.1
International equity markets also experienced weakness during this risk-off period. Economies across Asia and Europe tend to be structurally more dependent on oil and gas exports from the Middle East, making them highly susceptible to these types of supply shocks. A rapidly strengthening U.S. dollar also acted as a headwind for domestic investors holding international assets due to corresponding foreign currency weakness.
Amid the broader market drawdown, President Trump provided a critical catalyst by announcing that his administration was engaged in constructive dialogue with Iranian officials. While the actual substance and potential outcome of the diplomatic discussions remained highly uncertain, financial markets are forward-looking and rapidly priced in the possibility of a quick resolution. This news sparked a sharp rally across global equities, and that positive momentum persisted through the end of the quarter. This culminated with President Trump’s announcement of a two-week ceasefire allowing global equities to continue to climb higher.
Despite the severe intra-quarter drawdowns, this late momentum helped mask the underlying volatility. The S&P 500 and Dow Jones Industrial Average both finished the first quarter down less than 5%, while the NASDAQ 100 Index closed the period roughly 5.9% lower. U.S. mid-cap and small-cap indices demonstrated relative strength and still managed to post positive returns for the quarter.1
Moving forward, investors must closely monitor the ongoing situation in Iran and evaluate the lingering threat of elevated energy costs. If crude oil remains expensive for an extended duration, those higher input costs could compress corporate profit margins, restrict consumer discretionary spending, and weigh heavily on broader equity markets.
Bond Markets
The U.S. bond market also experienced volatility throughout the first quarter. Investors entered the year positioned for moderate growth in the U.S. economy and generally anticipated one to three interest rate cuts from the Federal Reserve. This optimistic outlook initially pushed bond yields lower across the Treasury yield curve and sparked a rally in bond prices.
That momentum reversed quickly in March as the military conflict in Iran escalated and global energy prices jumped. Interestingly, the typical rush to safe-haven U.S. Treasuries did not materialize. Instead, yields moved higher, credit spreads widened, and bond prices declined. The immediate threat of stickier energy-driven inflation caused financial markets to reprice interest rate expectations for the remainder of the year, causing the Treasury yield curve to quickly shift higher.
For the full period, the Bloomberg U.S. Aggregate Bond Index, which measures the performance of intermediate-term U.S. investment-grade bonds, remained roughly flat. Interest rate-sensitive bonds underperformed as the Treasury yield curve shifted higher due to increased inflation concerns stemming from higher energy prices. Credit-sensitive bonds also exhibited broad weakness as investor appetite for risk deteriorated.
While corporate credit spreads have widened recently, they remain relatively tight by historical standards. The combination of rising financing costs and surging energy prices is creating an increasingly challenging macroeconomic environment. This dynamic can be an issue for highly leveraged companies that now face higher debt burdens alongside elevated operational costs.
Negative headline pressure is also building across the private credit market as participants increasingly question concentrated exposures to heavily indebted firms tied to artificial intelligence ventures. Credit investors will need to determine if this recent volatility presents a strategic buying opportunity or serves as an early warning signal for a broader downturn in the credit cycle.
Commodity Markets
The geopolitical conflict in Iran sent ripples through global commodity markets during the first quarter. Both the energy and precious metals sectors experienced significant volatility and sharp reversals from their prior trends.
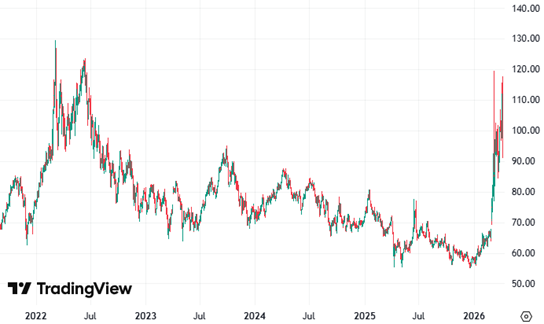
Investors quickly grew concerned about severe oil and natural gas supply shocks. Iran’s retaliatory shutdown of the Strait of Hormuz created a critical logistical bottleneck for global energy distribution. WTI Crude Oil spiked from approximately $55 per barrel from its December 2025 lows to a peak near $120 per barrel in March.
Oil remained volatile as the conflict continued but dropped below $100 per barrel following President Trump’s announcement of the two-week ceasefire with Iran. This ongoing geopolitical uncertainty suggests that oil prices could remain elevated and volatile.
WTI Crude Oil Price
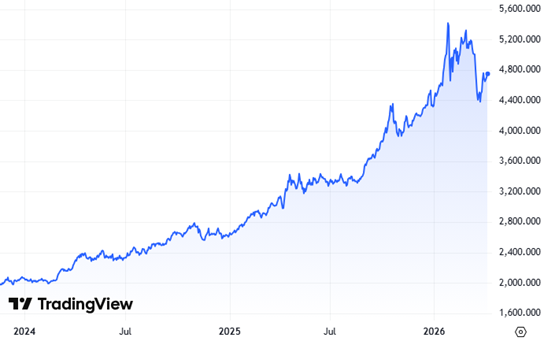
Gold started the quarter strong as it continued its bullish trading momentum from late 2025. The precious metal reached roughly $5,500 per ounce by the end of January. Extreme volatility soon ensued as gold quickly reversed course and declined approximately 20% in just over a week. While gold slowly rallied from those initial lower levels, it broke lower once again when the Iran conflict reignited. Gold bottomed at approximately $4,200 per ounce in March before rallying into the end of the quarter.
Gold Price
Currency Markets
Like the other asset classes, the performance of the U.S. dollar provided a classic example of a tale of two halves in the first quarter. The year began with the U.S. Dollar Index facing notable downward pressure as it hit lower levels in late January. Markets were pricing in Fed rate cuts alongside cooling inflation data.
That entire environment shifted dramatically in March when geopolitical tensions escalated in Iran and energy prices began to spike. As global risks mounted, safe-haven demand for the U.S. dollar returned, fueled by the potential that rising oil prices could lead to stickier inflation and higher interest rates for longer.
Despite the early weakness, the U.S. Dollar Index rallied 1.7% for the full first quarter.1 If the Iran conflict can reach a quick resolution, market participants could shift their attention back to a better macroeconomic environment. This could reignite anticipations for a weaker dollar as investors re-embrace the narrative of softer inflation and a more accommodative Fed policy. If the conflict in the Middle East escalates further, global investors may continue to gravitate toward the U.S. dollar.
SOURCES
- Morningstar Direct. Performance provided as total returns. U.S. Mid Caps is defined by the Russell Mid Cap TR USD index. U.S. Small Caps is defined by the Russell 2000 TR USD index. U.S. Growth is defined by the Russell 3000 Growth TR USD index. U.S. Value is defined by the Russell 3000 Value TR USD index. International Developed is defined by the MSCI EAFE NR USD index. Emerging Markets is defined by the MSCI Emerging Markets NR USD index. U.S. Agg Bond is defined by the Bloomberg U.S. Aggregate Bond TR USD index. U.S. Investment Grade Corp is defined by the Bloomberg U.S. IG Corp USD 300 M TR USD Index. U.S. High Yield is defined by the Bloomberg High Yield Corporate TR USD index. Broad Commodities is defined by the Bloomberg Commodity TR USD index. WTI Crude Oil is defined by the Bloomberg Sub WTI Crude Oil TR USD Index. Gold is defined by the Bloomberg Sub Gold TR USD Index. Industrial Metals is defined by the Bloomberg Sub Industrial Metals TR USD Index. Short-Term Treasuries defined by the Bloomberg 1-3 Yr U.S. Treasury TR USD index. Intermediate-Term Treasuries defined by the Bloomberg Intermediate U.S. Treasury TR USD Index. Long-Term Treasuries defined by the Bloomberg Long-Term U.S. Treasury TR USD Index.
- FactSet. Earnings Insight. 4/2/26.
- CME Group. FedWatch Tool. Retrieved 4/8/26 fromhttps://www.cmegroup.com/markets/interest-rates/cme-fedwatch-tool.html
- U.S. Bureau of Labor Statistics, All Employees, Total Nonfarm [PAYEMS], retrieved from FRED, Federal Reserve Bank of St. Louis; https://fred.stlouisfed.org/series/PAYEMS, April 6, 2026.
- TradingView.com. WTI Crude Oil. Retrieved 4/8/26 from https://www.tradingview.com/chart/S5oI8Odc/?symbol=TVC%3AUSOIL
- TradingView.com. Gold. Retrieved 4/8/26 from https://www.tradingview.com/chart/S5oI8Odc/?symbol=TVC%3AGOLD

Eric Kulwicki, CFA®, CFP®, brings 20+ years of experience, currently serving as an independent investment consultant, portfolio manager, and wealth advisor for institutional and retail clients. On KulwickiInsights.com, Eric shares his timely perspectives on financial markets, investment strategies, and other financial topics. He also offers online investment education courses for beginner and intermediate investors, and coaching sessions for DIY investors seeking professional guidance.