

Oil Spikes, Interest Rates Shift Higher, Equities Mixed
Throughout Q3 2026, rebounding energy prices and higher interest rates pressured broader financial markets. The escalating conflict in Iran drove increases across crude and refined fuels, raising concerns that these input costs could contribute to additional inflation, negatively impacting consumers and businesses.
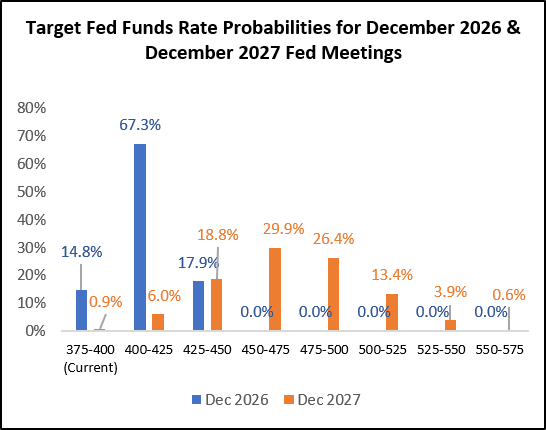
Faced with renewed inflationary pressures, the Federal Reserve, led by new Fed Chair Kevin Warsh, responded by raising the federal funds rate by 25 basis points (0.25%) in September to a target range of 3.75% to 4.00%. The Fed continued to signal its commitment to anchoring long-term inflation expectations.
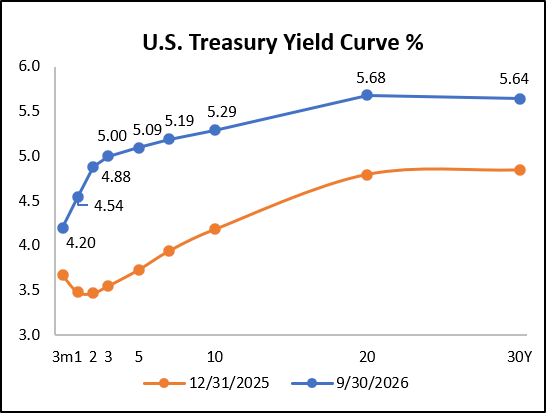
As inflation remained sticky, U.S. Treasury yields pushed higher across the curve as bond investors repriced the market, placing downward pressure on interest rate-sensitive bonds. The heavily watched U.S. 10-year Treasury yield climbed above 5.0% to trade near 5.35%, at levels not seen since 2002. A heavy surge in corporate bond issuance this year, coupled with total U.S. government debt eclipsing $40 trillion, compounded supply-side pressures across bond markets. These elevated yields could tighten financial conditions for consumers and corporate borrowers alike.
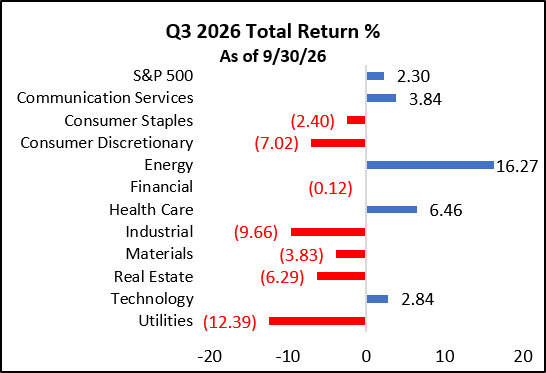
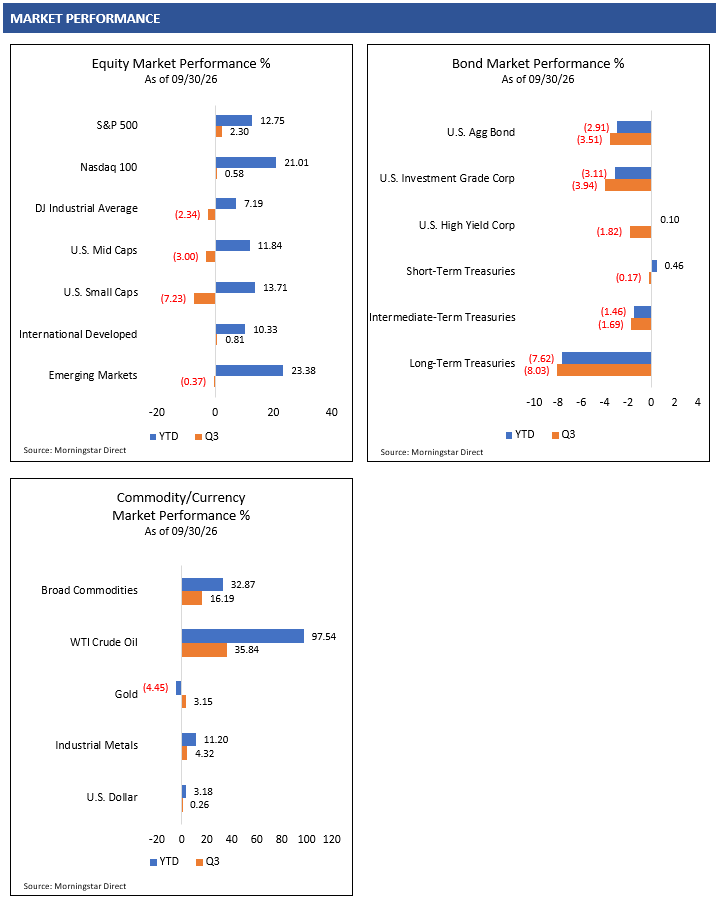
Against a backdrop of rising energy costs and elevated interest rates, equity markets delivered mixed performance in Q3. While the S&P 500 gained 2.30% and the technology-heavy Nasdaq 100 moved 0.58% higher, these headline returns masked significant underlying volatility.1 Cyclical and rate-sensitive sectors bore the brunt of the pressure, as capital rotated back into secular AI buildout beneficiaries and cash-rich balance sheets better insulated from macroeconomic headwinds.
Fed Balances Inflation Fight with Employment Stability
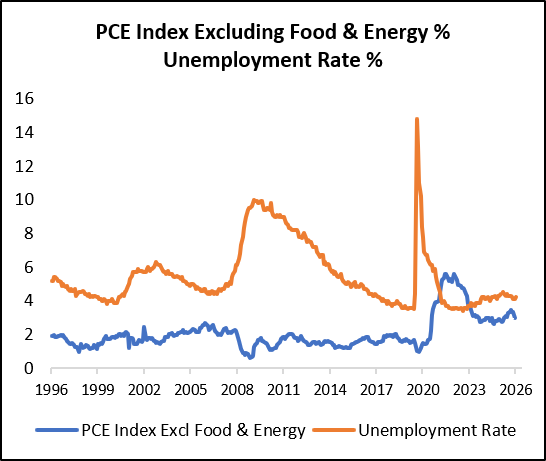
The Federal Reserve remains focused on its dual mandate of price stability and maximum employment to chart the course for monetary policy. While the more well-known Consumer Price Index (CPI) captures headline household costs, policymakers rely heavily on the Core Personal Consumption Expenditures (PCE) Index, which strips out volatile food and energy, to gauge structural inflation trends and calibrate the trajectory of benchmark interest rates.
As illustrated in the following chart, the Core PCE Index continues to run persistently above the Fed’s 2% long-term inflation target, while unemployment sits near the lower boundary of its 20-year range. With the labor market remaining fundamentally sound, policymakers could retain the flexibility to prioritize price stability over near-term employment support.
Amid persistent inflation, and even following the Fed’s 25 basis point rate hike in September, financial markets are pricing in one to two additional 25 basis point hikes before year-end, with the potential for further rate hikes in 2027. Investors continue monitoring incoming data closely to gauge whether sustained economic momentum could prompt further Federal Reserve rate hikes and how those moves might affect various asset classes.
Wholesale Inflation Threatens Consumer Budgets
Inflation continues to challenge the corporate sector, where margin pressures typically emerge before hitting household budgets. Over the 12 months ending August 2026, the Producer Price Index rose 5.4%, signaling persistent wholesale cost acceleration.5 Surging energy costs served as the primary catalyst, while food prices remained relatively flat. Within services, price pressures stayed elevated, led by transportation and warehousing, where higher diesel fuel costs fed into freight and distribution services.
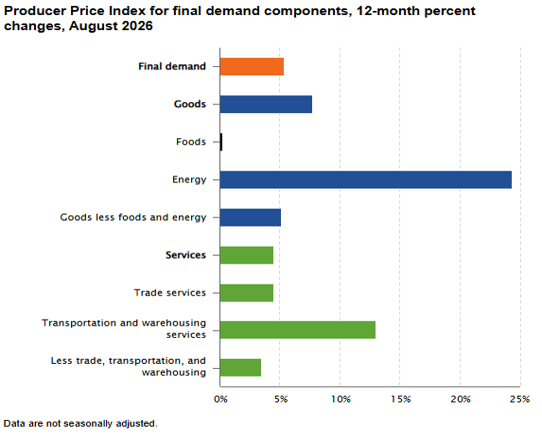
Because businesses often find it difficult to absorb prolonged input cost increases, many companies look to pass a portion of these expenses downstream to end users. As a result, persistent strength across wholesale goods and services points to continued upward pressure on upcoming Consumer Price Index (CPI) readings, potentially threatening to squeeze household purchasing power in the months ahead.
Stable U.S. Economic Growth Amid Higher Rates, For Now
U.S. economic growth is projected to hold relatively steady heading into 2027, with Wall Street Journal survey economists forecasting Real GDP between 2.0% and 2.5%.6 Yet much like the equity markets, headline stability masks underlying divergence as interest rate-sensitive sectors, particularly consumer discretionary and real estate, remain vulnerable to a higher-for-longer interest rate environment.
We continue to see strength in U.S. manufacturing and services sectors, with September Purchasing Managers’ Index (PMI) readings of 54.5 (manufacturing) and 54.9 (services) reflecting economic expansion. Although headline PMI readings indicate solid expansion, price subindices of 77.9 in manufacturing and 74.0 in services highlight persistent inflationary pressures spreading across the broader economy.7
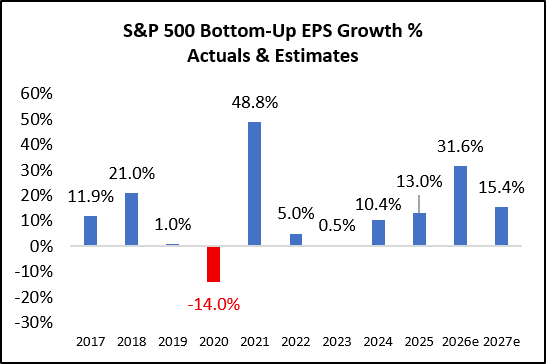
U.S. corporate earnings continue to show notable strength, with consensus forecasts targeting over 30% S&P 500 EPS growth in 2026 and double-digit gains into 2027.8 Even after accounting for typical downward revisions as forecasts mature, these elevated profit expectations could provide support for U.S. equities heading into next year.
Markets are closely watching the conflict in Iran for supply-driven oil spikes that could reignite inflation and keep interest rates higher for longer. Higher borrowing costs risk curbing consumer and business spending, slowing U.S. economic momentum, and creating potential headwinds for corporate profitability and the financial markets.
Navigating Markets as Midterm Elections Near
As news headlines shift some focus toward the upcoming midterm elections, consensus forecasts point to Democrats potentially reclaiming the House majority, while the Senate appears closely contested. Historically, financial markets have generally favored a divided government. Political gridlock often acts as a natural check against sweeping fiscal overhauls and aggressive policy changes, fostering a more predictable tax and regulatory environment for consumers and businesses.
For long-term investors, investment fundamentals like earnings power, balance sheet strength, and cash flow generation often drive investment performance more than the short-term noise of Washington politics.
Q3 Market Review
Equity Markets
Equity volatility picked up in the second half of Q3 as oil prices and bond yields moved higher. While the S&P 500 Index closed the quarter up 2.3%1, that headline gain masked significant dispersion beneath the surface. Energy led all sectors on the strength of oil prices, while balance sheet strength and secular demand helped communication services, technology, and health care post solid gains despite higher rates.
Mid and small cap companies and economically sensitive sectors struggled in Q3, led lower by consumer discretionary, industrials, materials, and real estate. Utilities also faced headwinds as rising bond yields created stiffer competition for dividend-seeking investors.
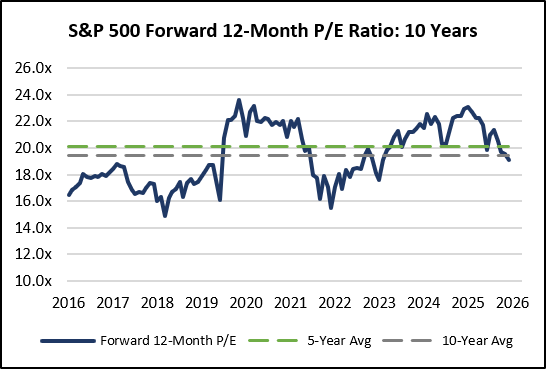
Even with strong year-to-date returns across U.S. equities, earnings growth has outpaced price appreciation, driving the forward 12-month P/E multiple for the S&P 500 Index down from 22.2x at the end of 2025 to 19.1x at the end of September 2026. This multiple compression may provide a more moderate valuation environment, which could help support investor demand for U.S. stocks heading into next year.
International equity markets posted mixed results in Q3. Developed markets held steady, with the MSCI EAFE Index returning 0.81%, while the MSCI Emerging Markets Index, with its heavy concentration in Asian technology hardware and semiconductors, declined -0.37%.1
Bond Markets
Bond markets were broadly weaker in Q3, with the Bloomberg U.S. Aggregate Bond Index down -3.51% and longer-duration Treasuries declining even further.1 Bond yields have pushed higher across the curve as markets price in persistent inflation and a higher federal funds rate under the Fed’s restrictive monetary policy. Interestingly, this has created a policy divergence between the Fed and the U.S. Treasury.
While the Fed maintains a restrictive stance to tame inflation, some market observers note that the U.S. Department of the Treasury’s efforts to absorb supply through buybacks could work against the central bank’s goal of tightening financial conditions.
U.S. Treasury Yields
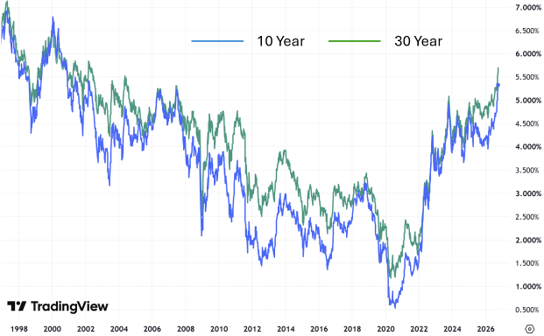
Whether the U.S. Treasury can successfully counter these upward rate pressures and the Fed’s tightening remains to be seen, particularly against the backdrop of continued U.S. fiscal deficits, elevated Treasury auction sizes, and heavy corporate bond issuance.
Credit spreads remain historically tight, reflecting investor confidence in corporate balance sheets, even as corporate issuance accelerates sharply. Heavy borrowing by tech hyperscalers to fund AI capex is driving a wave of investment-grade bond supply. As bond markets digest this volume alongside heavy Treasury issuance, the supply overhang is driving yields higher and pressuring the prices of existing bonds.
Commodity Markets
Energy prices remain volatile amid recurring setbacks in diplomatic efforts between the U.S. and Iran. Early in Q3, WTI Crude traded below $70 per barrel on hopes of regional de-escalation. As talks stalled and hostilities reignited, however, crude surged past $100 per barrel before settling at $90 per barrel, capping a 35.84% gain at the end of the quarter.1,12
U.S. Regular Gas and Diesel Prices
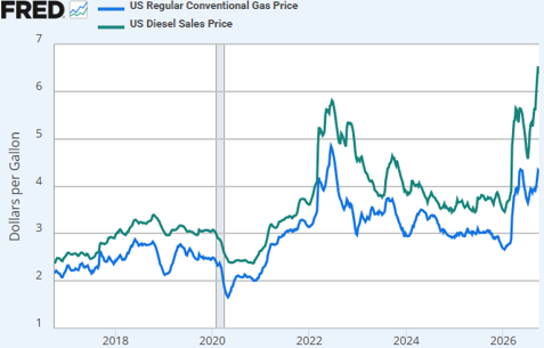
Persistently high energy prices threaten to flow through production and logistics into consumer prices. If entrenched across supply chains, these costs could keep inflation uncomfortably high for an extended period. Regular gas prices have continued to press higher while diesel prices, which impact transportation costs, have hit record highs.
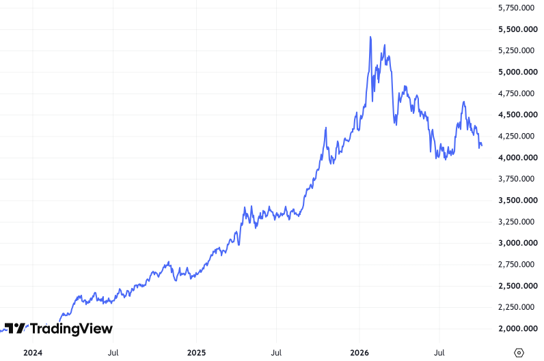
Gold experienced heightened volatility throughout Q3 2026 as pressure from climbing Treasury yields clashed with safe-haven demand. Gold rallied 3.15% in the quarter.1 Federal Reserve policy tightening and higher bond yields have elevated the opportunity cost of holding non-yielding assets like gold, prompting conservative investors to consider rotating toward fixed income for reliable cash flow.
Geopolitical friction and macroeconomic uncertainty continue to support gold demand. Over the past few years, central banks seeking currency reserve diversification have been accumulating gold on pullbacks, providing an underlying source of demand. Looking ahead, market participants will watch closely to see whether this sovereign demand holds up against a higher-for-longer interest rate environment.
Gold Price
Currency Markets
The U.S. dollar also experienced choppy trading across much of Q3 2026, whipsawed by shifting geopolitical risks and fluctuating growth expectations. With the Federal Reserve hiking the fed funds rate in September, bond yields climbing across the curve, and U.S. economic growth remaining resilient, dollar-denominated assets drew renewed demand, driving the currency higher into quarter end. A continued rally in the U.S. dollar could be a headwind for U.S. investors holding international assets with foreign currency exposure. Consequently, investors should monitor this additional source of volatility closely as currency swings unfold.
SOURCES
- Morningstar Direct. Performance provided as total returns. U.S. Mid Caps is defined by the Russell Mid Cap TR USD index. U.S. Small Caps is defined by the Russell 2000 TR USD index. U.S. Growth is defined by the Russell 3000 Growth TR USD index. U.S. Value is defined by the Russell 3000 Value TR USD index. International Developed is defined by the MSCI EAFE NR USD index. Emerging Markets is defined by the MSCI Emerging Markets NR USD index. U.S. Agg Bond is defined by the Bloomberg U.S. Aggregate Bond TR USD index. U.S. Investment Grade Corp is defined by the Bloomberg U.S. IG Corp USD 300 M TR USD Index. U.S. High Yield is defined by the Bloomberg High Yield Corporate TR USD index. Broad Commodities is defined by the Bloomberg Commodity TR USD index. WTI Crude Oil is defined by the Bloomberg Sub WTI Crude Oil TR USD Index. Gold is defined by the Bloomberg Sub Gold TR USD Index. Industrial Metals is defined by the Bloomberg Sub Industrial Metals TR USD Index. Short-Term Treasuries defined by the Bloomberg 1-3 Yr U.S. Treasury TR USD index. Intermediate-Term Treasuries defined by the Bloomberg Intermediate U.S. Treasury TR USD Index. Long-Term Treasuries defined by the Bloomberg Long-Term U.S. Treasury TR USD Index.
- U.S. Treasury. Daily Treasury Par Yield Curve Rates https://home.treasury.gov/resource-center/data-chart-center/interest-rates/TextView?type=daily_treasury_bill_rates&field_tdr_date_value=2026
- Source: FRED. U.S. Bureau of Economic Analysis, Personal Consumption Expenditures Excluding Food and Energy (Chain-Type Price Index) [PCEPILFE], retrieved from FRED, Federal Reserve Bank of St. Louis; https://fred.stlouisfed.org/series/PCEPILFE, .. U.S. Bureau of Labor Statistics, Unemployment Rate [UNRATE], retrieved from FRED, Federal Reserve Bank of St. Louis; https://fred.stlouisfed.org/series/UNRATE, .
- CME Group. FedWatch Tool. Retrieved 10/3/26 fromhttps://www.cmegroup.com/markets/interest-rates/cme-fedwatch-tool.html
- U.S. Bureau of Labor Statistics. Producer Price Index for Final Demand Components. September 16, 2026. Retrieved from https://www.bls.gov/opub/ted/2026/producer-price-index-up-5-4-percent-for-the-12-months-ended-august-2026.htm
- American Staffing Association. GDP Quarterly. Retrieved from https://americanstaffing.net/research/asa-data-dashboard/gdp-quarterly-projections/
- Institute for Supply Management. September Manufacturing and Services PMIs. https://www.ismworld.org/supply-management-news-and-reports/reports/ism-pmi-reports/services/september/
- FactSet. Earnings Insight. 9/28/26
- FactSet. S&P 500 Index Forward 12-Month Price-to-Earnings Ratio. 9/30/26.
- TradingView.com. 10-Year Treasury Yield. 30-Year Treasury Yield. As of 10/8/26.
- U.S. Energy Information Administration, US Regular Conventional Gas Price [GASREGCOVW], retrieved from FRED, Federal Reserve Bank of St. Louis; https://fred.stlouisfed.org/series/GASREGCOVW, . U.S. Energy Information Administration, US Diesel Sales Price [GASDESW], retrieved from FRED, Federal Reserve Bank of St. Louis; https://fred.stlouisfed.org/series/GASDESW, .
- TradingView.com. WTI Crude Oil. Retrieved from https://www.tradingview.com/chart/S5oI8Odc/?symbol=TVC%3AUSOIL
- TradingView.com. Gold. Retrieved from https://www.tradingview.com/chart/S5oI8Odc/?symbol=TVC%3AGOLD

Investment Consultant | Portfolio Manager | Wealth Advisor
Eric is a member of the Larson Financial investment committee and provides private wealth management services through Intrua Financial.
A passionate advocate for financial literacy, Eric also develops multimedia educational courses and market insights designed to demystify complex investment concepts for individual investors.
Prior to his current roles, Eric served as a Senior Portfolio Analyst and Vice President at Robert W. Baird, and previously as a Mutual Fund Specialist at U.S. Bancorp Fund Services.
He is a CFA® charterholder and a CERTIFIED FINANCIAL PLANNER™ professional. Eric earned his Master of Business Administration with a specialization in Finance from Marquette University, graduating with honors, and holds a Bachelor of Business Administration from the University of Wisconsin–Madison.