
SUMMARY
- U.S. Equities: Remain slightly bullish on U.S. equities. I have increased concerns with overspeculation and momentum trading driving AI-related and unprofitable companies’ stocks. Prefer diversified exposure to higher-quality, growing companies with appropriate stock valuations and across market cap and equity sectors.
- International Equities: Remain slightly bullish on international developed and emerging market equities as valuations remain appropriate. Prefer diversified exposure to higher-quality, growing companies across geographies, market cap and sectors. The increased concentration in Asian technology and the AI theme in the MSCI Emerging Markets Index is notable.
- High Income-Generating Assets: Remain moderately bullish, with a preference for diversification across asset classes and strategies, but less bullish on closed-end fund exposure as discounts to NAV are tight.
- Commodities (Gold & Oil): Remain slightly bearish overall as gold price technicals show persistent weakness and oil prices could decline from current levels if tensions in the Middle East soften at some point in the coming months.
- Conservative Assets (Bonds): Shifted to moderately bullish as interest rates have shifted higher. Willing to add to high-quality duration at these levels. Remain cautious on tight spreads in investment grade credit.
- Other (Hedges): Prefer high-quality bonds as a defensive hedge rather than non-traditional strategies like trend-following. Would consider structured, options-based hedged equity strategies for more conservative investors wanting to maintain equity exposure.
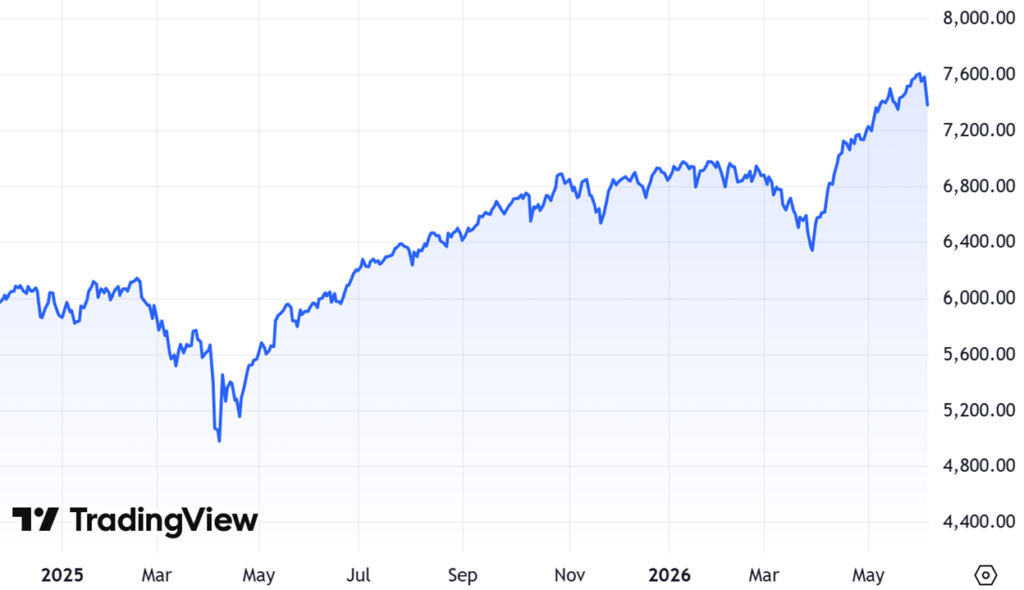
Since my last Outlook and Positioning piece on March 10th, global equity markets have experienced a strong rally, which has been driven primarily by significant momentum in artificial intelligence-related stocks. Investors have been flocking to these companies due to the potential for strong fundamental earnings growth tied to AI. This secular growth theme has provided a powerful tailwind for the broader market and continues to attract substantial capital.
The trend higher in the equity markets wasn’t without volatility over the last few months. In early March, equity markets began to decline, and the sell-off quickly picked up speed as geopolitical tensions intensified between the U.S. and Iran. This wave of selling pressure ultimately pushed U.S. equity markets into correction territory, which is often defined as a 10% decline from recent highs.
When President Trump indicated that diplomatic discussions with Iran were progressing positively, risk appetite returned to the markets and global equities quickly rebounded from the lows. The combination of the potential for easing geopolitical tensions and the underlying strength of the artificial intelligence trade allowed the markets to resume their broader move higher.
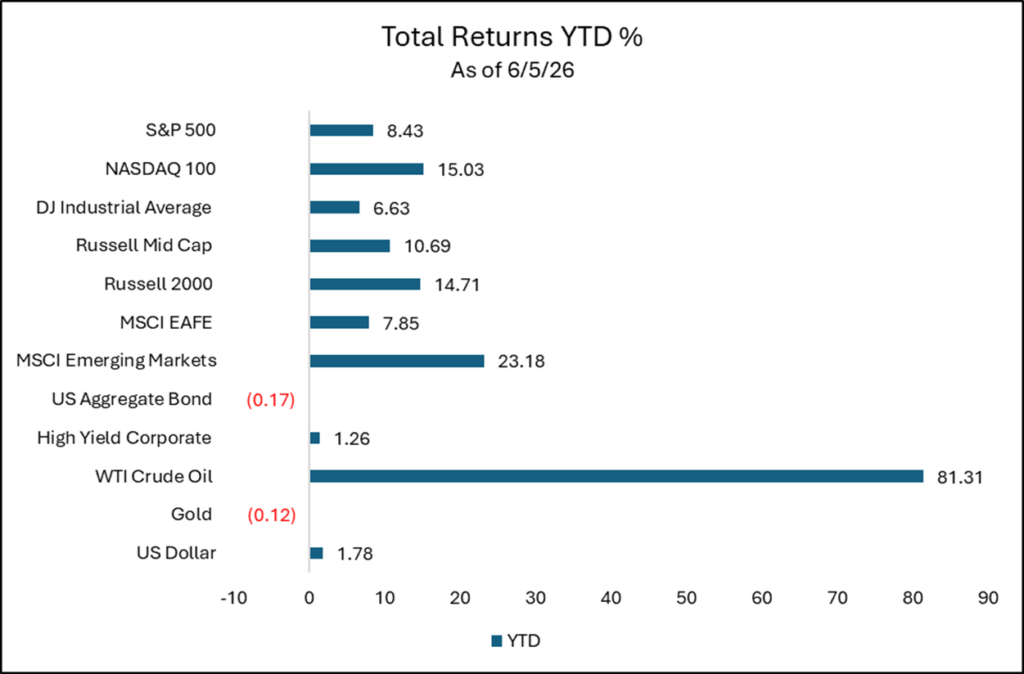
On June 5th, a number of companies tied to the artificial intelligence theme saw their stocks decline rather significantly, which negatively impacted the broader markets. On that day, the S&P 500 declined 2.6%, the NASDAQ 100 declined 4.8% and the S&P 500 Technology Sector Index declined 6.7%.
One day doesn’t make a trend but following a significant rally in these AI-related stocks, a pullback at some point shouldn’t be surprising for investors.
S&P 500 Index
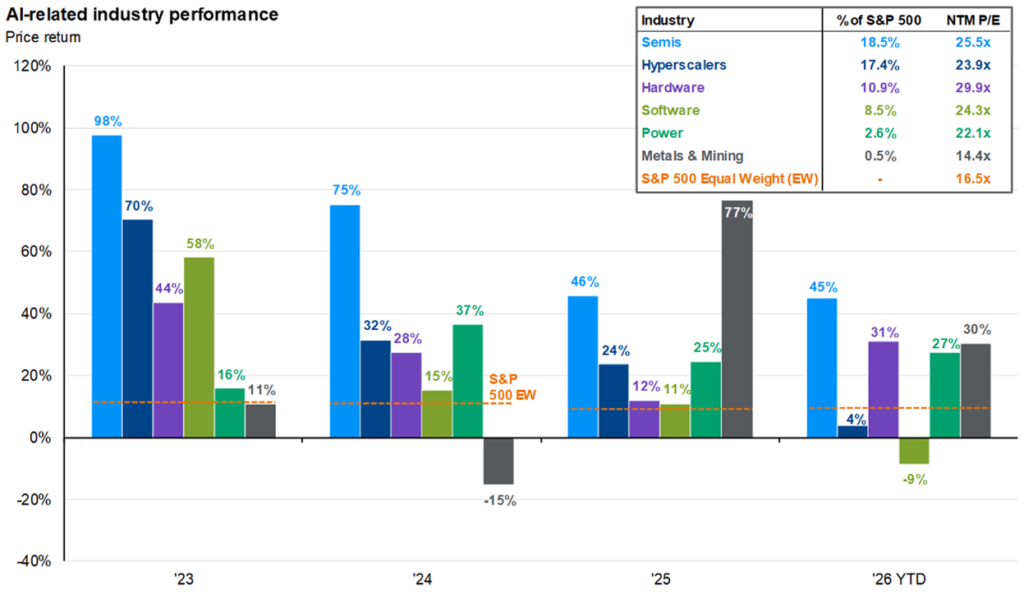
Momentum in artificial intelligence stocks and select other areas has achieved a level of outperformance rarely seen in recent history. Outside of the artificial intelligence and energy sectors, overall stock performance has been somewhat muted. This narrow participation environment doesn’t necessarily cause concern, but the parabolic moves higher in some stocks are, and they should be monitored. I would personally prefer to see broader participation from the rest of the market.
As shown in the following performance chart, momentum and high-beta stocks have driven the majority of the gains across large, mid, and small cap indices this year. High-quality stocks have participated in the rally but are noticeably lagging behind.

The following chart highlights how equity sectors like technology, industrials, and materials that can have direct ties to the massive artificial intelligence infrastructure buildout may have correlated to strong equity performance YTD.
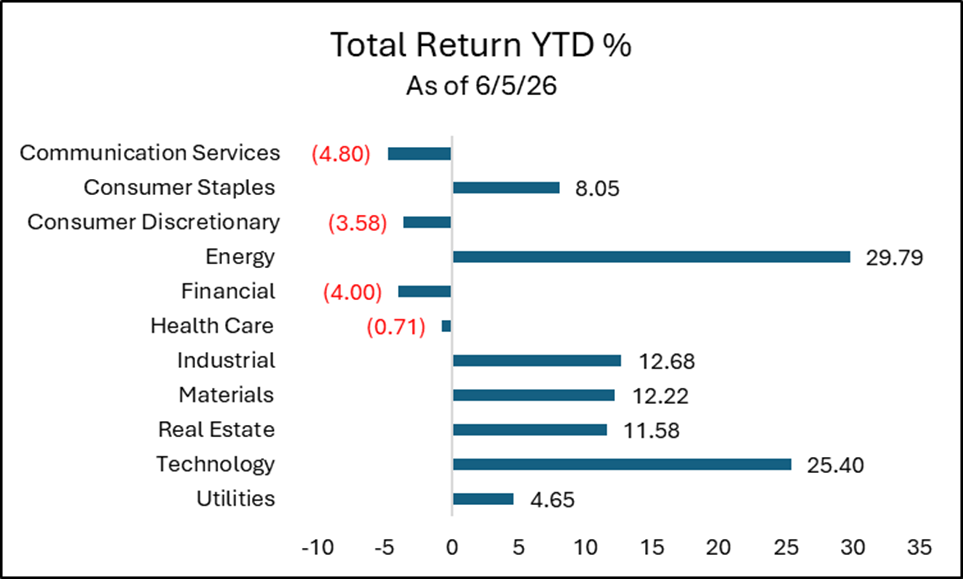
Constructing data centers and developing advanced hardware require immense physical resources and industrial capacity. Artificial intelligence technology is also anticipated to consume a significant amount of electricity. This surging demand for power, combined with higher oil prices resulting from the United States and Iran conflict, has led to strength in the energy sector this year.
A question facing investors right now is whether the artificial intelligence and energy themes can maintain their dramatic outperformance, or if the market rally will eventually broaden out to include other areas that have lagged, such as financials and health care.
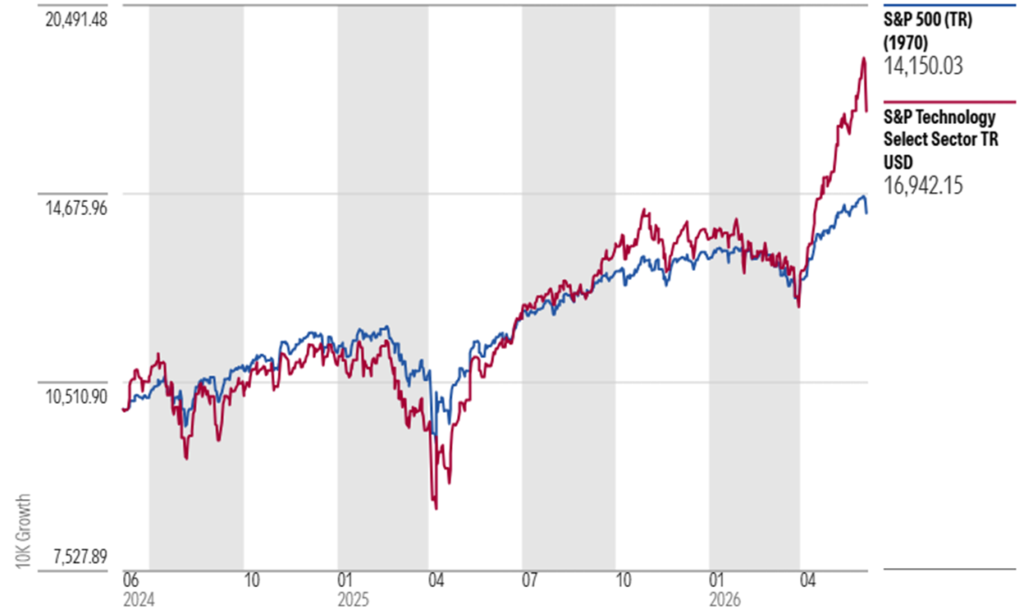
You can see in the following chart just how quickly the S&P 500 technology sector has rallied over the past few months. I’m usually skeptical when prices rise this sharply as momentum can move markets regardless of fundamentals. Investors should at least prepare for a period of consolidation or a move lower if the artificial intelligence narrative exhibits some cracks.
S&P 500 Index vs. Technology Sector 2-Year Performance
International Equities
International equities have delivered strong returns this year. Although European and Japanese markets appear to have relatively attractive valuations than the heavily concentrated U.S. market, they lag in capturing the technology strength of U.S. companies.
Emerging economies are benefiting from stabilizing trade and resilient consumer demand. Additionally, Taiwan and South Korea are experiencing massive tailwinds from their exposure to artificial intelligence. This broad participation indicates a steadily expanding global economy.
Commodities
Crude oil has rallied significantly due to tight supplies resulting from the conflict in the Middle East and the limited oil tanker traffic in the Strait of Hormuz. These rising energy costs can act as a tax on consumers and businesses, complicating inflation management for central banks.
Gold has given up some of its initial gains from earlier in the year. Gold lost technical momentum from its strength last year as investors shifted toward higher-yielding assets. Gold hasn’t been much of a risk asset or inflation hedge and has become more of a momentum trade, in my opinion.
U.S. Dollar
The U.S. Dollar Index is slightly higher this year. Persistent price pressures may be forcing the Federal Reserve to keep interest rates elevated for the time being. These higher rates and foreign investors’ demand for U.S. technology investments may have resulted in a slight preference the U.S. dollar this year.
U.S. Corporate Fundamentals Remain Solid
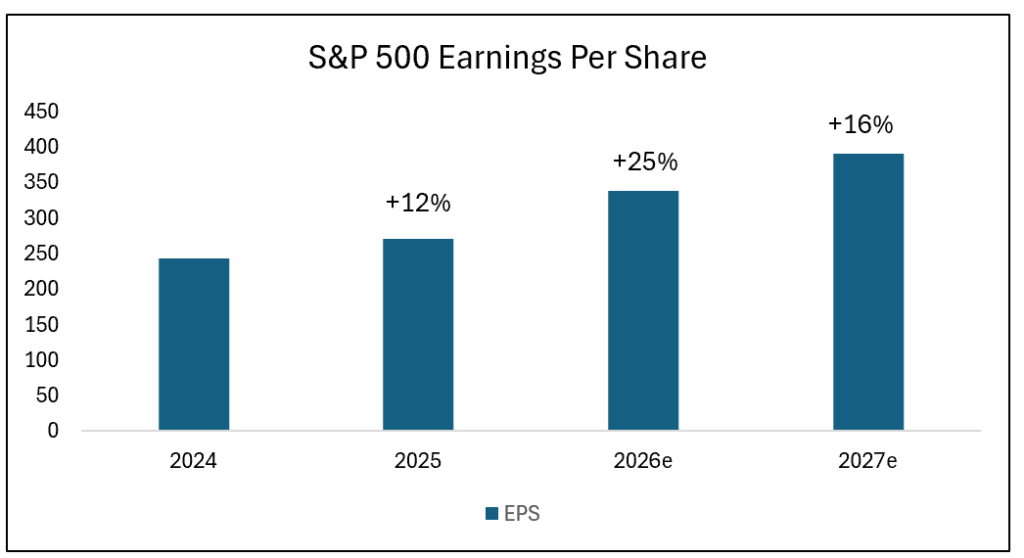
A significant portion of the strong performance in U.S. equities has been driven by solid corporate fundamentals. This is particularly noticeable within the S&P 500 Index, which is heavily influenced by the technology sector and the ongoing artificial intelligence infrastructure buildout.
Recent data from FactSet and other major financial institutions project earnings per share growth for the S&P 500 Index to exceed 20% in 2026, with continued double-digit growth expectations for 2027. This impressive earnings power may continue to keep investors bullish.
When large cap companies show this kind of consistent growth, the positive sentiment can broaden out and provide a lift to other areas of the U.S. equity market. It can also lead to increased speculation, which is what I believe we’re experiencing this year.
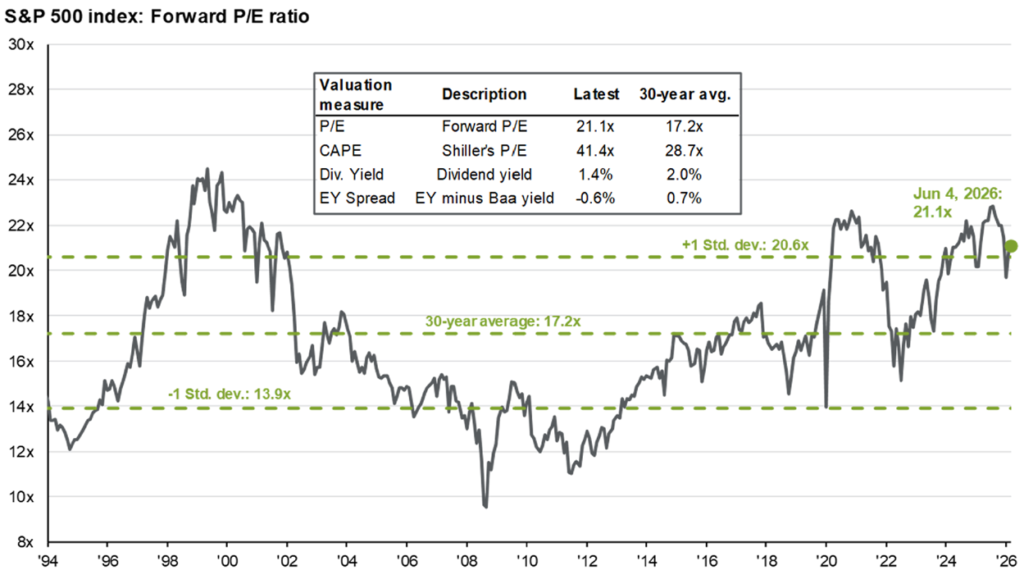
When looking at the U.S. equity market, valuations are elevated but not at extremes. Even after the strong rally YTD, current valuations are not at the extremely elevated levels we have witnessed in the recent past. The S&P 500 Index currently trades at a forward price-to-earnings multiple of roughly 21x. This indicates that corporate earnings have been catching up to rising stock prices, which is healthy from a broader market perspective.
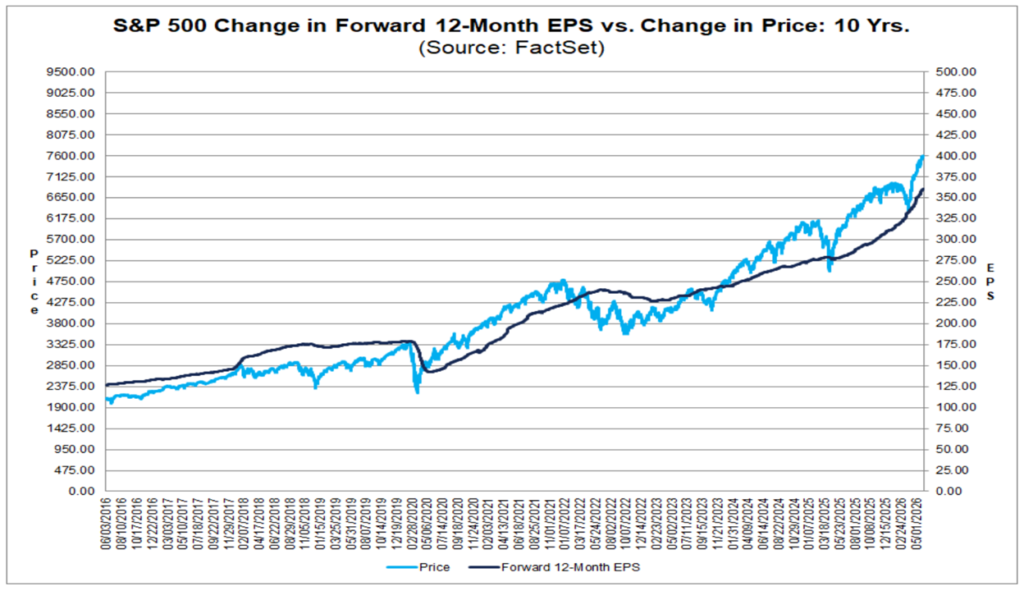
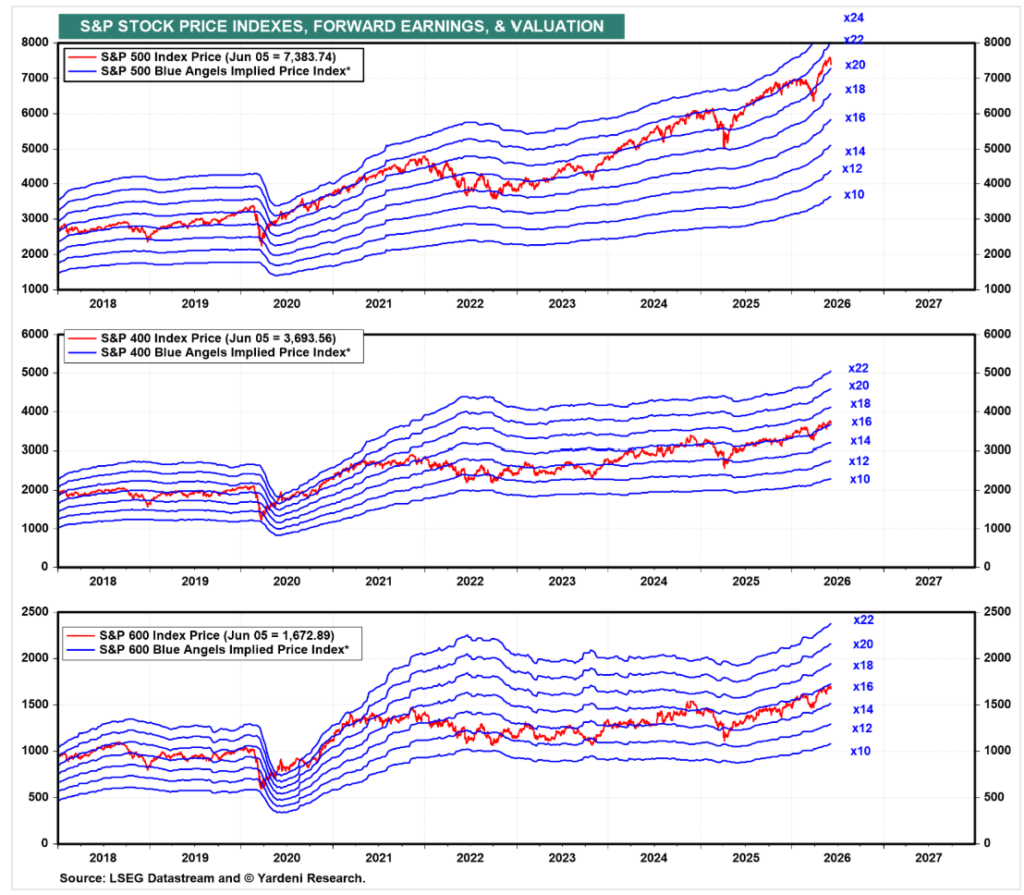
In the following chart, the value of the S&P 500 Index (light blue line) has exceeded the trajectory of the forward 12-month earnings per share (dark blue line). This could indicate the potential for consolidation or a correction in value (price) at some point.
Looking across the large cap S&P 500, the S&P MidCap 400, and the S&P SmallCap 600 indices, corporate earnings estimates continue to move higher. A bit of caution is needed though, as valuations are currently trending toward the upper end of their historical ranges.
S&P Stock Price Indexes, Forward Earnings & Valuation
Ideally, the broader equity market will enter a period of consolidation where equity indices stabilize without suffering a deep correction. Financial markets do not need to experience a sharp decline to correct elevated valuations. Stock prices can simply move sideways, allowing underlying earnings to grow and eventually meet the price. This sideways price action could provide the necessary time for equity prices to fully align with underlying earnings growth.
Investors should always be prepared for a potential pullback in prices as valuations fluctuate and revert to more normalized historical levels. Attempting to time the market by shifting to cash or defensive positions simply because valuations look stretched in the short term is notoriously difficult. If you get it wrong, market timing can be detrimental to long-term investment performance.
Heavy Artificial Intelligence Capital Expenditures and Cash Flow Realities
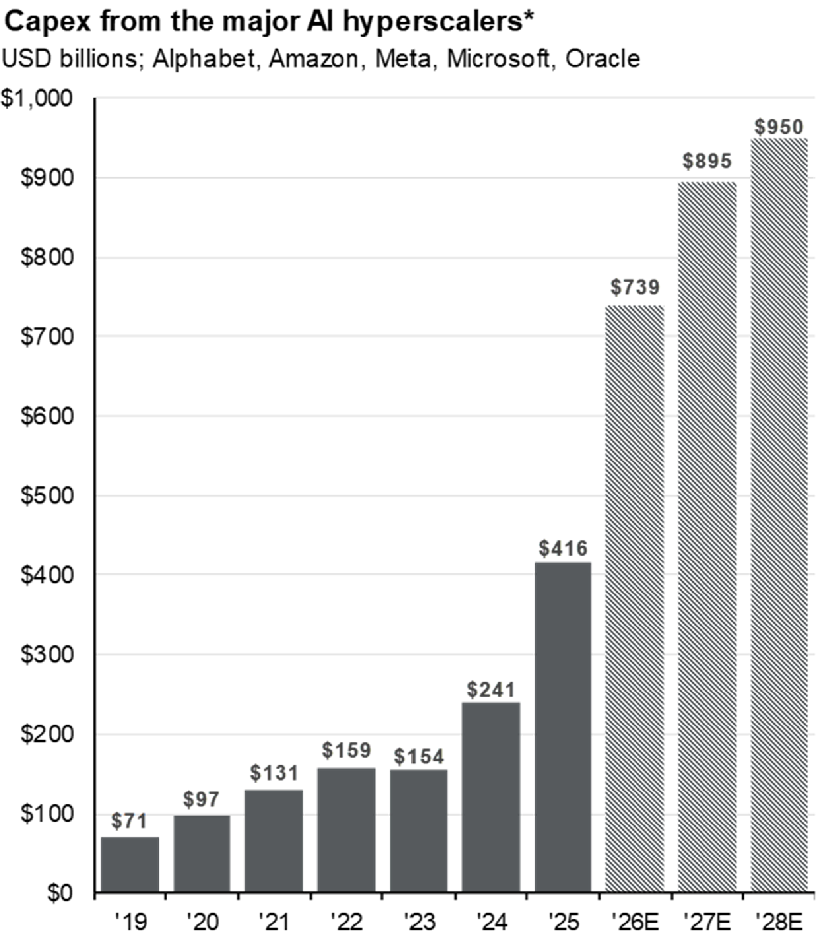
A primary driver behind this artificial intelligence buildout is the unprecedented capital spending by some of the largest companies in the world. Capital expenditures are anticipated to increase substantially throughout 2026 and remain elevated for the foreseeable future. A prime example of this scale is Alphabet’s recent announcement of an $80+ billion equity offering to help support its aggressive investments in artificial intelligence.
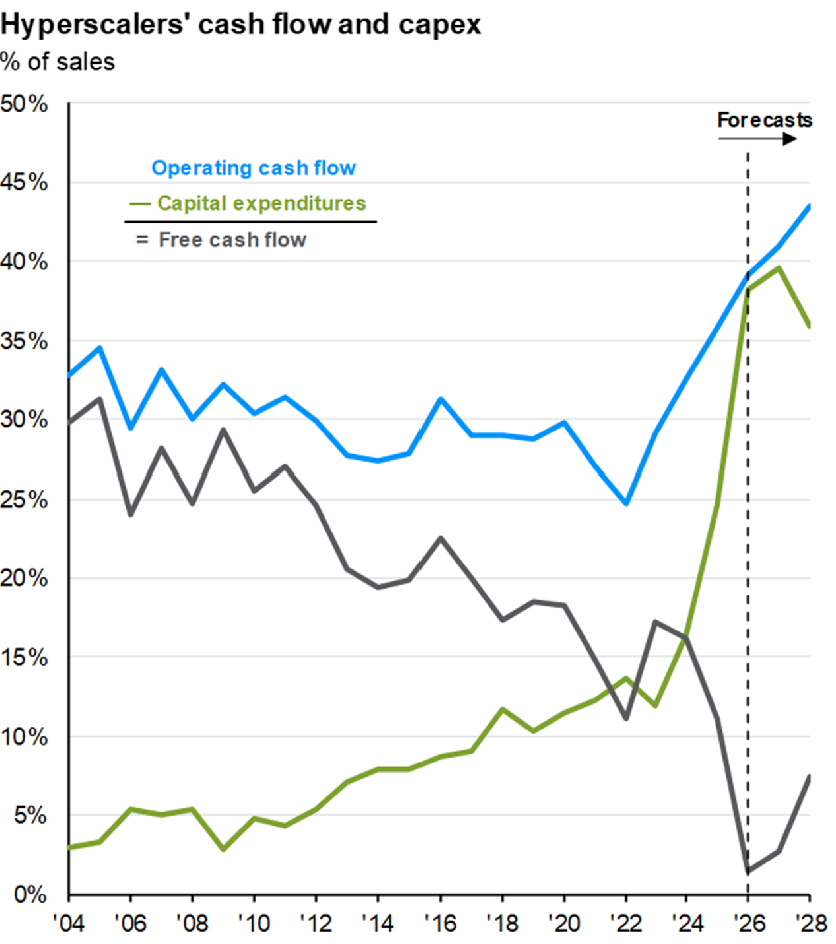
These hyperscalers are committing a ton of capital to infrastructure, and near-term free cash flow is expected to decline. A dilemma for investors is whether these aggressive and cash-intensive investments will eventually translate into strong future free cash flows. These technology giants are making a bet that their infrastructure dominance will secure future profitability. Investors buying into these current valuations are taking a significant leap of faith alongside them.
A Rush of Mega Initial Public Offerings
The current market environment is also characterized by a sudden rush of blockbuster initial public offerings. Companies like SpaceX, which now integrates significant artificial intelligence exposure through its internal ecosystem, along with Anthropic and expected filings from OpenAI, are collectively seeking trillions of dollars in market valuation.
When you combine this flood of new equity issuance with massive secondary stock offerings from existing publicly traded technology giants, it naturally breeds a degree of skepticism. Historically, a concentrated wave of significant stock offerings in a single sector can signal a short-term peak in speculative momentum. When so much supply of new stock enters the market simultaneously, it can absorb investor liquidity and limit further upward price movement.
While artificial intelligence possesses the potential to meaningfully transform the global economy, investing directly in the infrastructure buildout involves risk. Rather than trying to time an overly concentrated exposure to pure artificial intelligence companies or heavily extended infrastructure plays, I prefer a more diversified approach.
I continue to prefer diversified exposure to high-quality, growing companies across market cap, sectors and geography. These high-quality companies are generally established businesses with fundamental strength that may have the flexibility to adopt and leverage artificial intelligence technology. By implementing these new AI tools, high-quality companies may be able to optimize their own operations and exhibit resilient growth for years to come without bearing the direct financial risks of the initial infrastructure buildout.
Energy Market Volatility and Geopolitical Friction
The ongoing conflict between the U.S. and Iran has become a primary driver of volatility across global energy markets. Sentiment surrounding U.S. and Iran negotiations changes quickly, causing the price of West Texas Intermediate crude oil to remain volatile.
As the U.S. and Iran conflict persists, physical supplies of oil become tighter. Recent inventory data indicate that global crude oil supplies in storage are depleting at a rapid pace. If diplomatic efforts fail to yield a resolution soon, threats to the free movement of oil through vital shipping lanes in the Middle East could intensify. This risk to supply can create upward pressure on energy prices, which could become a bigger problem for the global economy.
The prolonged elevation of oil prices has direct consequences for the broader economy because energy is a key input cost for many industries. When companies face higher expenses to fuel their factories and transport their products, they eventually pass those costs along to consumers. This process can cause energy inflation to transform into broader, structural inflation across a wide range of everyday goods and services.
For the Federal Reserve, this type of supply-driven inflation is particularly difficult to manage. Central bank tools, such as adjusting interest rates, are designed to cool consumer demand, but they cannot easily fix supply chain disruptions or geopolitical blockades. If sticky inflation becomes embedded in the economy, policymakers may be forced to maintain a restrictive stance for longer than financial markets originally anticipated.
Upward Pressure on Interest Rates
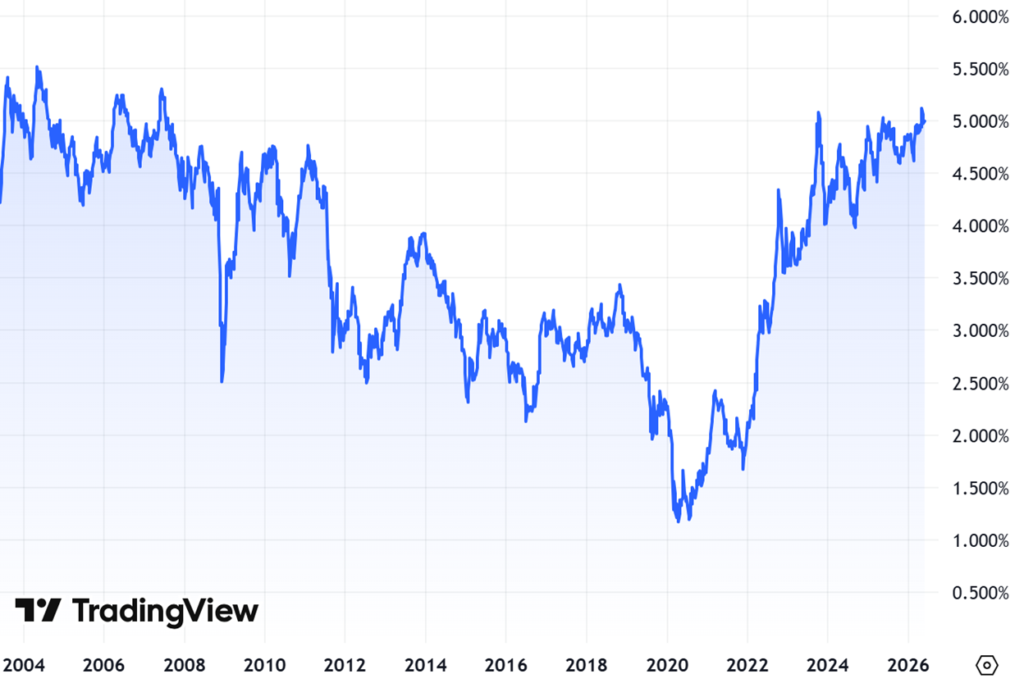
As energy prices have fluctuated, U.S. interest rates have adjusted rapidly to reflect a higher inflation premium. The yield on the 30-year Treasury bond recently reached approximately 5.2%, marking its highest level since 2007. In the fixed income market, rising long-term yields mean that investors are demanding more compensation to protect against the eroding effects of long-term inflation. This shift pushes up borrowing costs across the economy, influencing everything from corporate debt issuance to consumer mortgage rates.
U.S. 30-Year Treasury Yield
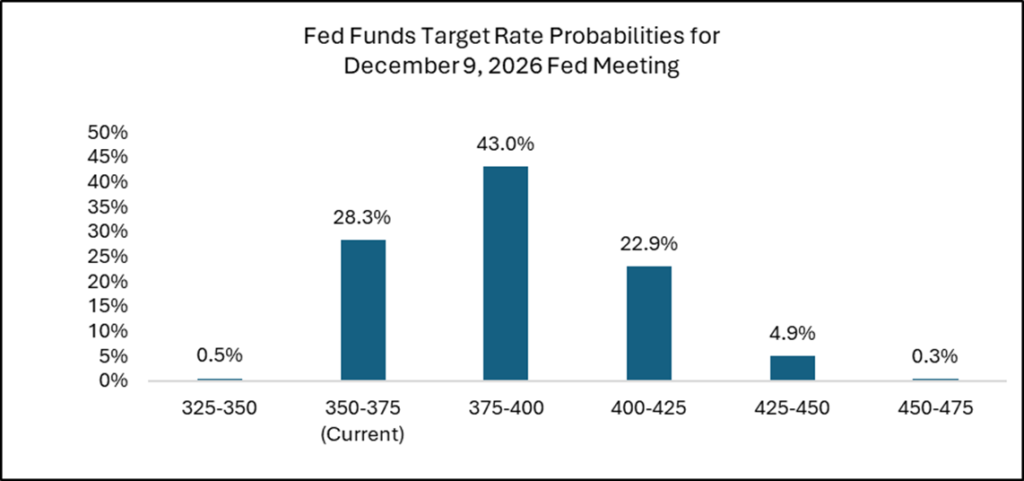
According to recent data from the CME FedWatch Tool, which tracks the expectations of moves in the fed funds rate, market participants are pricing in an increasing probability of another interest rate hike before the end of the year. The Federal Reserve has set its target range for the federal funds rate at 3.50% to 3.75%.
Fed Funds Rate Probabilities for December 9, 2026 Fed Meeting
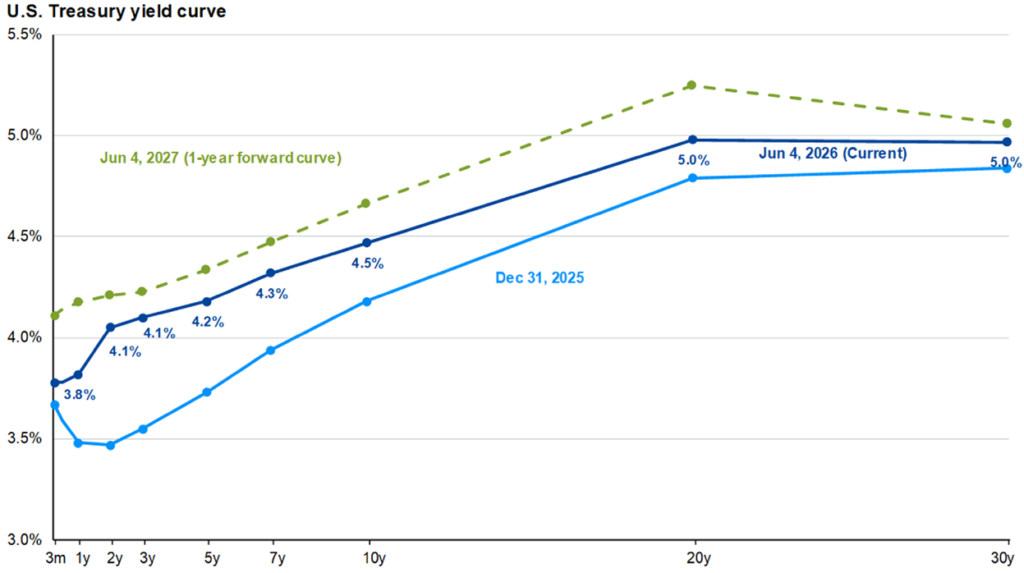
Looking further out, the one-year forward Treasury yield curve indicates that the market is preparing for higher interest rates from current levels, shifting away from earlier expectations of monetary easing.

Tariffs and the November Midterm Elections
Beyond the immediate concerns of the U.S. / Iran conflict, investors must also navigate other near-term uncertainties. The November midterm elections and renewed discussions surrounding international trade tariffs are likely to introduce additional policy uncertainty into the financial markets. Elections often spark short-term market swings as investors speculate on potential changes to tax policy and government spending.
Despite these geopolitical and macroeconomic headwinds, the underlying health of the U.S. economy provides solid support. As long as corporate fundamentals and earnings growth are anticipated to remain resilient, it might be difficult for investors to become overly bearish. This fundamental strength could continue to act as a floor under financial assets, supporting global equity markets even as interest rates and energy prices remain elevated.
My Positioning and Tactical Adjustments
Taking Advantage of Market Volatility
The market volatility in March and April, and now in early June, have created some tactical opportunities that I took advantage of. This primarily involved increasing and decreasing leveraged exposures to select areas of the equity and crypto markets.
When global equity markets weakened toward the end of March, technology stocks pulled back to levels that were attractive to me from a longer-term perspective. Within my Global Unconstrained strategy, I added a relatively small leveraged position in U.S. technology equities. The subsequent market rebound in April from when I added the position was quick. As technology stocks quickly recovered and approached my target price level, I liquidated the leveraged technology position to lock in profits.
As equity markets continued to rally, I made another adjustment, this time in U.S. small caps. A leveraged small cap position in my Global Unconstrained strategy tracks the Russell 2000 Index. A substantial portion of the companies within the index are currently unprofitable, making them vulnerable to periods of speculative momentum and rising borrowing costs. As the Russell 2000 Index continued to rally, I completely sold my leveraged small cap position and reallocated to my existing exposure to unleveraged, higher-quality small caps.
The cryptocurrency market has also experienced a significant decline, with Bitcoin and Ethereum falling substantially from their highs. I have held speculative exposure to both for several years, outside of the investment strategies that I formally manage. I view Bitcoin and Ethereum as completely speculative, without a real fundamental view on either, but I am willing to trade the volatility of the assets.
As Bitcoin and Ethereum have declined 50 to 60%+ from their highs, I added leveraged exposure to both Bitcoin and Ethereum in early June to take advantage of a potential rebound at some point.
Should Bitcoin and Ethereum continue to move materially lower, I’d be willing to increase leveraged exposure accordingly. If they rally enough from current levels, I’d be looking to take potential profits in the leveraged positions.
Tactical Rebalancing Opportunities
In addition to these targeted trades, the earlier volatility and subsequent rally in global equities provided opportunities for broader tactical rebalancing. Rebalances were executed across both leveraged and non-leveraged holdings within the U.S. Core X and the Global Unconstrained strategies over the last few months.
Following the strong rally in global equity markets this year, equity indices are trading very close to their historical highs. At these levels, overly aggressive positioning doesn’t make much sense to me. The Global Unconstrained strategy currently holds its lowest level of leveraged equity exposure in some time. If we experience a deeper market decline at some point, I’d be willing to increase risk accordingly.
RISK ASSETS

I maintain a slightly bullish outlook on risk assets.
Following the significant runup in artificial intelligence stocks, I’m increasingly cautious and somewhat skeptical. Instead, I prefer broad diversification across high-quality, growing companies across various sectors, geographies and market cap. While a number of higher-quality growth companies outside of the AI and non-profitable tech trade have lagged a bit over the last year or so, I’m sticking with my diversified exposure.
I also continue to favor high income-generating assets. This includes high yield corporate bonds, emerging markets debt, dividend growth equities, option income strategies, and closed-end funds. Diversified exposure across these areas can generate yields above 5%. This cash flow can provide some potential stability if global equity markets enter a sideways consolidation phase or turn deeper to the downside.
From my perspective, my allocation to multi-asset income strategies can act as a source of “drier powder” by providing readily available capital to deploy if equity markets decline to attractive levels for long-term positioning. We’re not close to those levels, so I’ll remain patient with my existing positioning.
U.S. EQUITIES
I remain slightly bullish on U.S. equities.
I maintain a strong preference for diversified exposure across high-quality, growing companies with solid balance sheets. A focus on diversification can help reduce the heavy concentration and potential speculation tied to the massive artificial intelligence infrastructure buildout. Underweighting this concentration might be a good or bad thing from a relative performance perspective. It just depends on how it the AI theme actually turns out versus its current hype, and I don’t invest with a focus on hype.
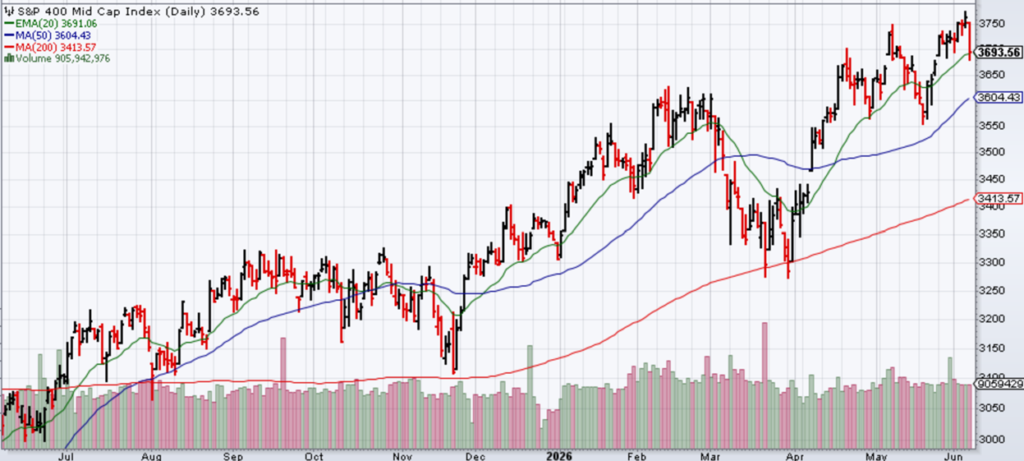
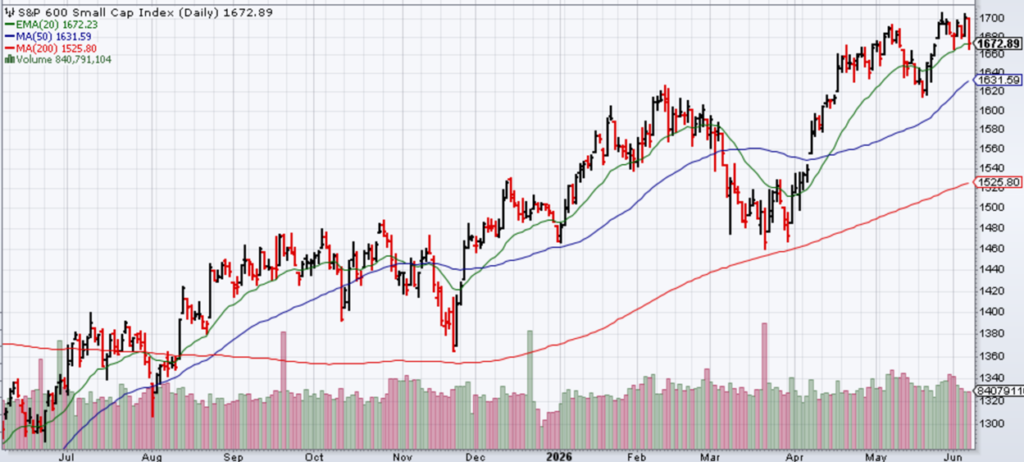
Outside of large caps, high-quality mid- and small caps haven’t kept pace with the broader rally seen in quality large caps. As a result, they currently appear to be trading at relatively attractive valuations. In my opinion, diversified exposure to these high-quality mid/small cap companies can provide a solid fundamental base for portfolios and potential longer-term growth.
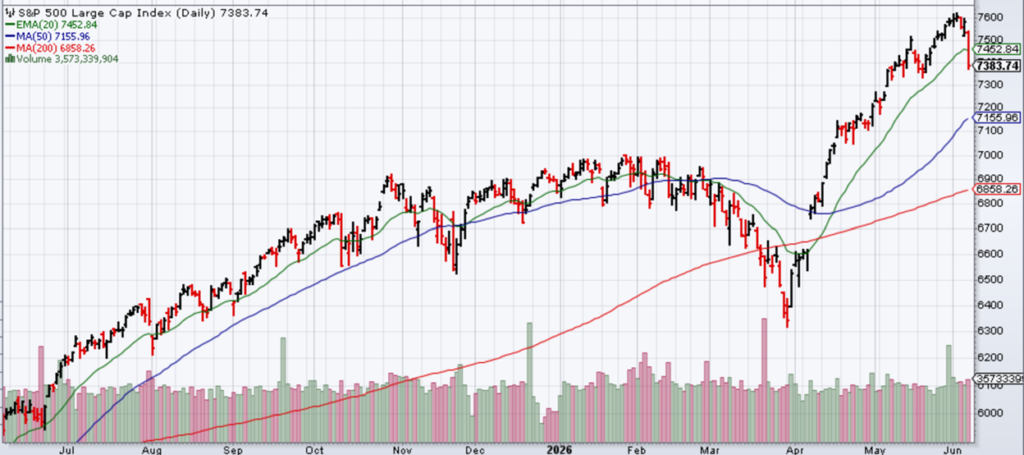
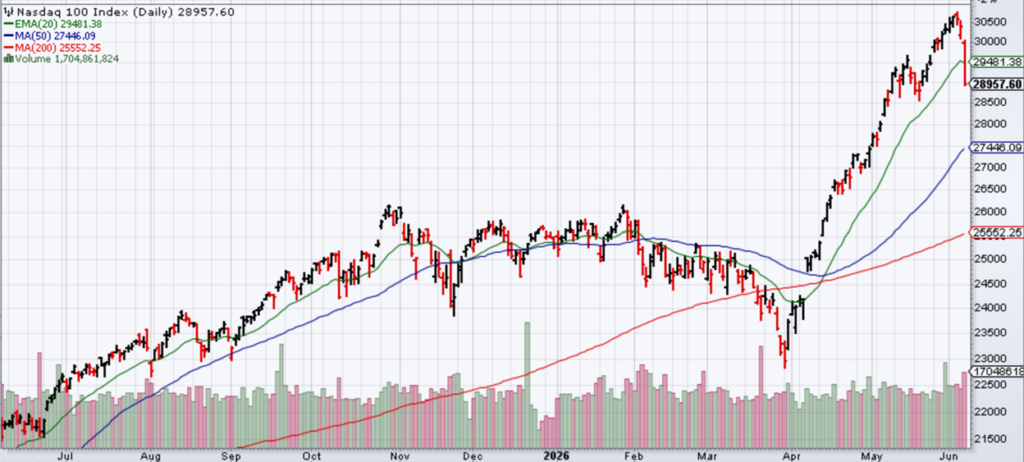
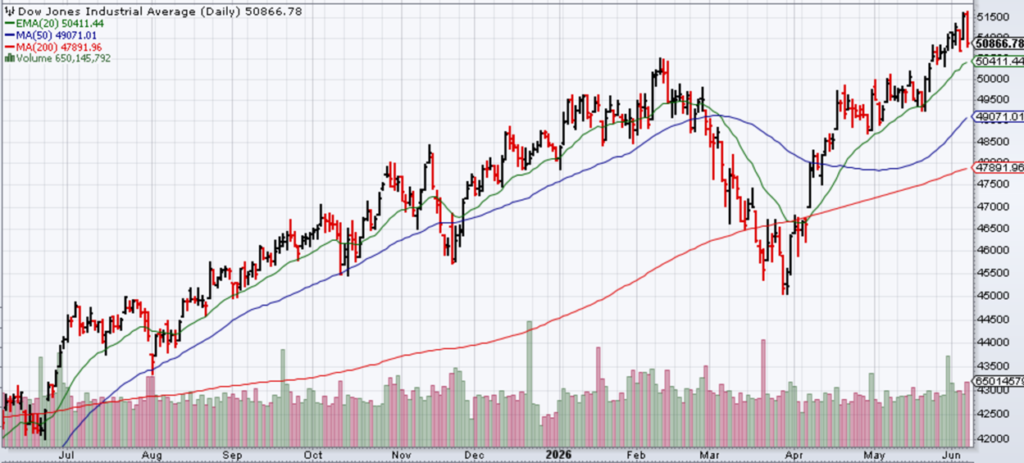
From a technical analysis perspective, major U.S. equity indices are trading at a significant distance above their 200-day moving averages. This suggests that the market may be slightly overextended in the short term. Historically, financial markets tend to revert toward this long-term moving average over time. At a minimum, investors should prepare for a potential market pullback or a period of sideways consolidation. For me, it at least signals that I should not be overly aggressive at these levels.
S&P 500 Index
NASDAQ 100 Index
Dow Jones Industrial Average Index
S&P 400 Mid Cap Index
S&P Small Cap 600 Index
FOREIGN EQUITIES
I remain slightly bullish on foreign equities at this time.
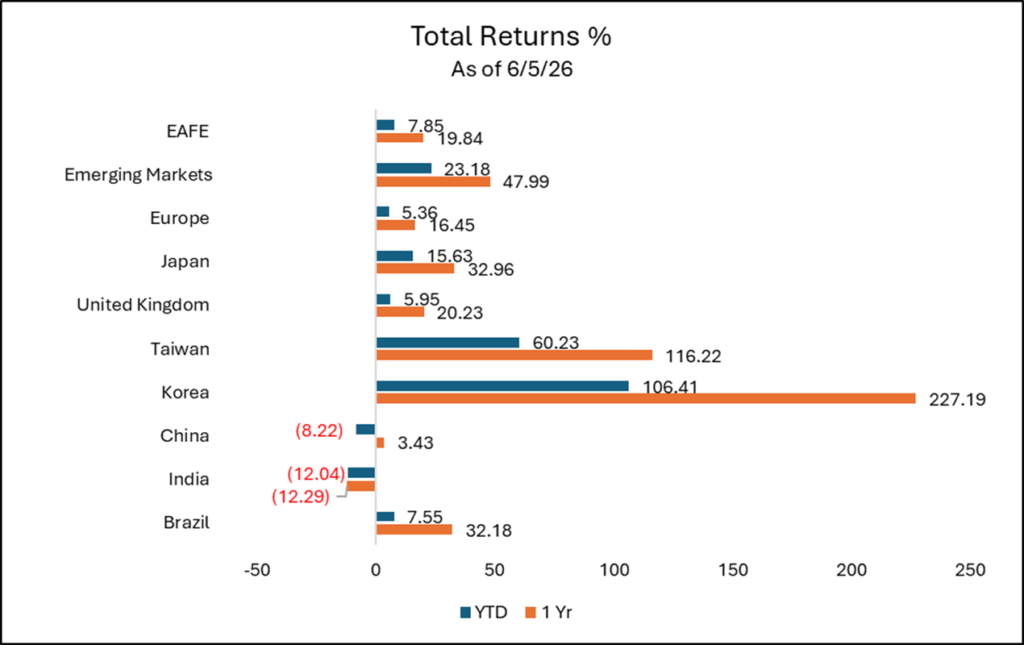
I continue to prefer broad diversification across various geographies and market capitalizations with a focus on higher-quality, growing companies. International equity markets have found support this year. The most notable outperformance has come from emerging markets.
Asian Technology and Emerging Markets
Within emerging markets, Asian companies tied directly to the artificial intelligence infrastructure buildout have been rewarded. Companies such as Taiwan Semiconductor, Samsung Electronics, and SK Hynix now collectively account for nearly 30% of the MSCI Emerging Markets Index. These semiconductor manufacturers have driven a massive portion of the broader emerging markets index’s returns over the past year.
Significant capital flows into the Taiwanese and South Korean equity markets may have been reallocated away from other major Asian economies like China and India, both of which have recently underperformed.
Outside of Asia, the Brazilian equity market has also found some support. As a commodity-rich country, Brazil is positioned to potentially benefit from the massive energy and physical material demands required for the global artificial intelligence infrastructure buildout.
Investors must recognize that the MSCI Emerging Markets Index is no longer heavily dependent on raw commodities as it was in previous decades. Today, it functions much more like an Asian technology index. The rapid increase in sector concentration within the index is a notable risk to be aware of. When exposure to emerging market equities is sized appropriately as a smaller allocation within a globally diversified portfolio relative to core U.S. equity exposure, this concentration is less of a material concern.
You can see the top constituents of the MSCI Emerging Markets Index below.
| Company | Portfolio Weighting % | Country | Sector | Total Ret YTD | Total Ret 1 Yr |
| Taiwan Semiconductor Manufacturing Co Ltd | 14.46 | Taiwan | Technology | 52.97 | 139.03 |
| Samsung Electronics Co Ltd | 7.78 | South Korea | Technology | 174.71 | 459.52 |
| SK Hynix Inc | 6.60 | South Korea | Technology | 218.32 | 823.39 |
| Tencent Holdings Ltd | 2.72 | China | Communication Services | -23.46 | -10.97 |
| Alibaba Group Holding Ltd Ordinary Shares | 2.07 | China | Consumer Discretionary | -14.29 | 5.12 |
| MediaTek Inc | 1.64 | Taiwan | Technology | 202.73 | 249.72 |
| Delta Electronics Inc | 1.19 | Taiwan | Technology | 138.84 | 479.65 |
| Hon Hai Precision Industry Co Ltd | 0.91 | Taiwan | Technology | 23.43 | 86.69 |
| Samsung Electronics Co Ltd Participating Preferred | 0.86 | South Korea | Technology | 136.96 | 338.51 |
| China Construction Bank Corp Class H | 0.81 | China | Financials | 13.69 | 22.26 |
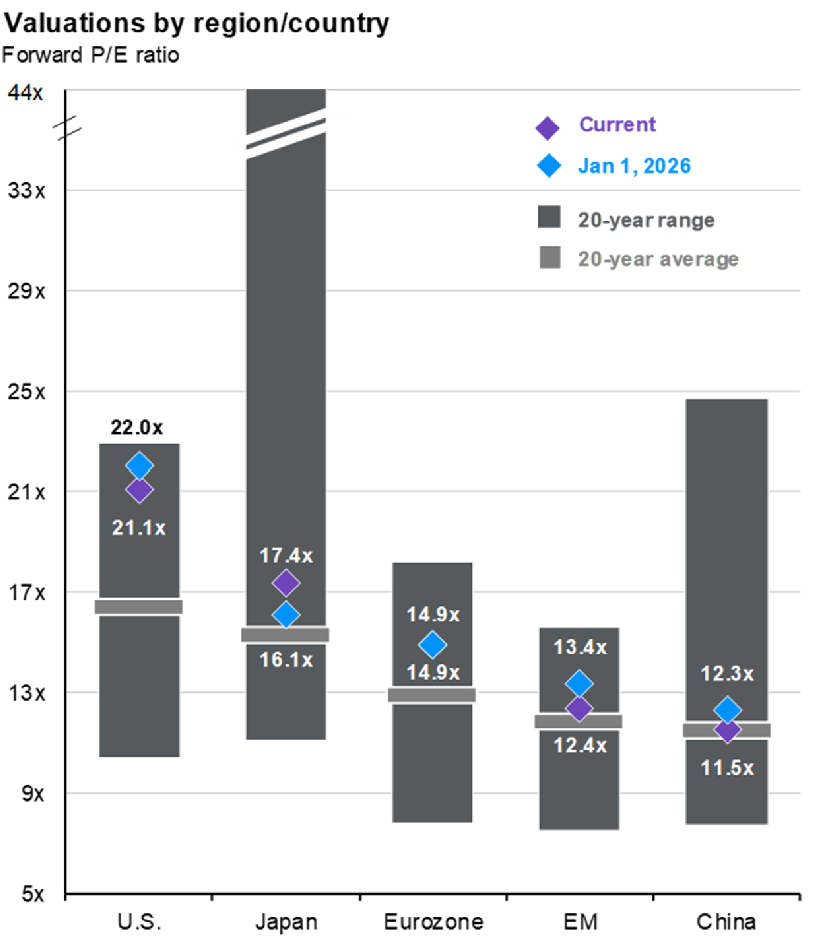
Looking forward, international corporate earnings growth is anticipated to remain solid, which could keep investors allocated to international equities.
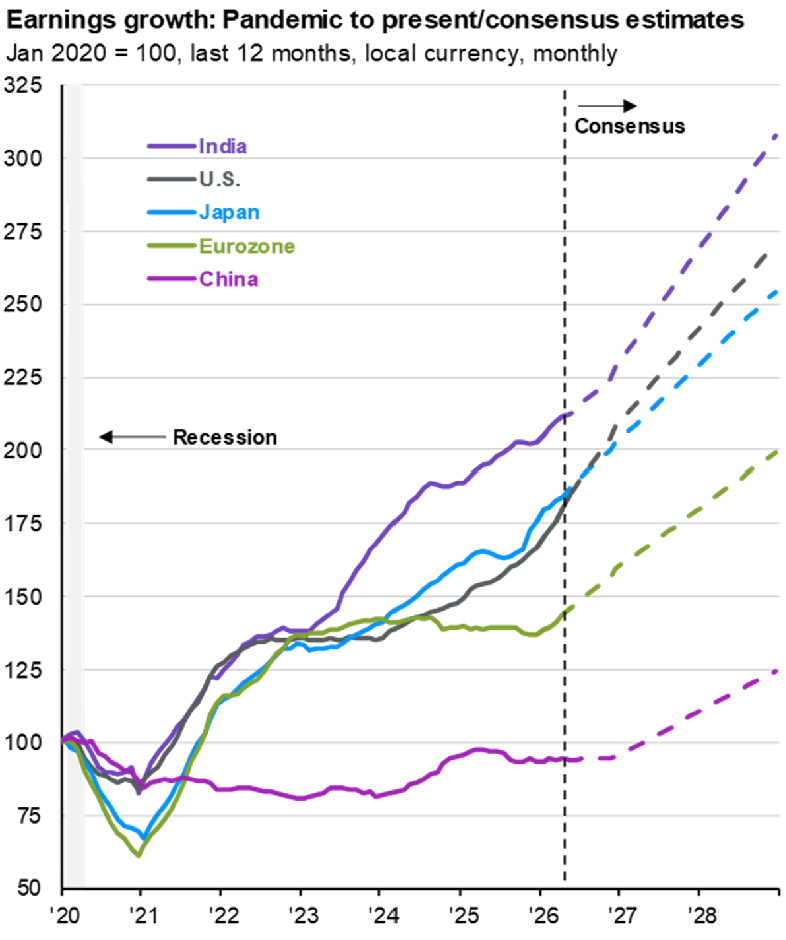
Per the following chart, valuations also appear somewhat reasonable.
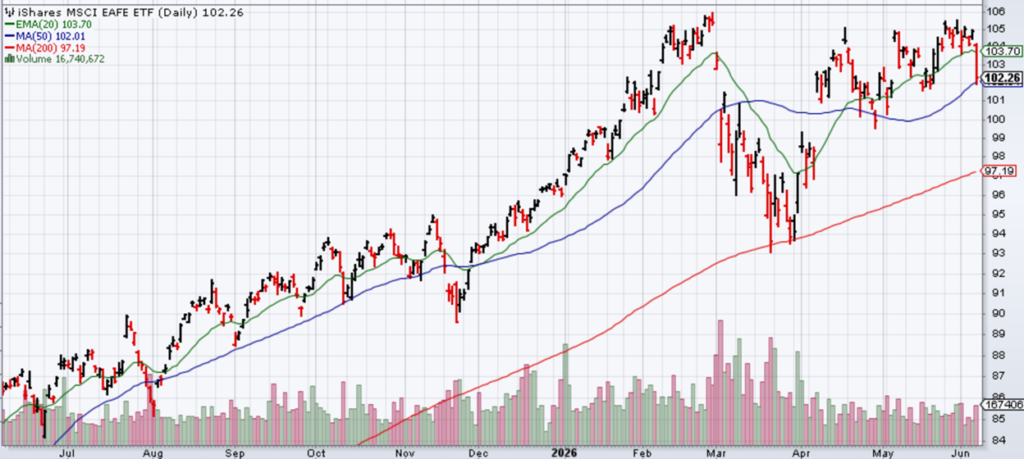
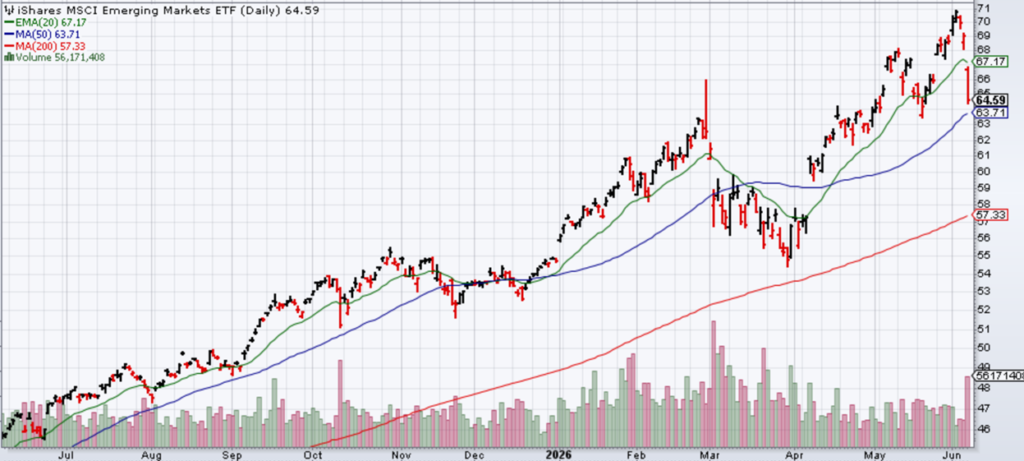
From a technical analysis perspective, international equity markets remain in a bullish trend, led by strength in emerging markets.
MSCI EAFE Index (proxied by the iShares MSCI EAFE ETF)
MSCI Emerging Markets Index (proxied by the iShares MSCI Emerging Markets ETF)
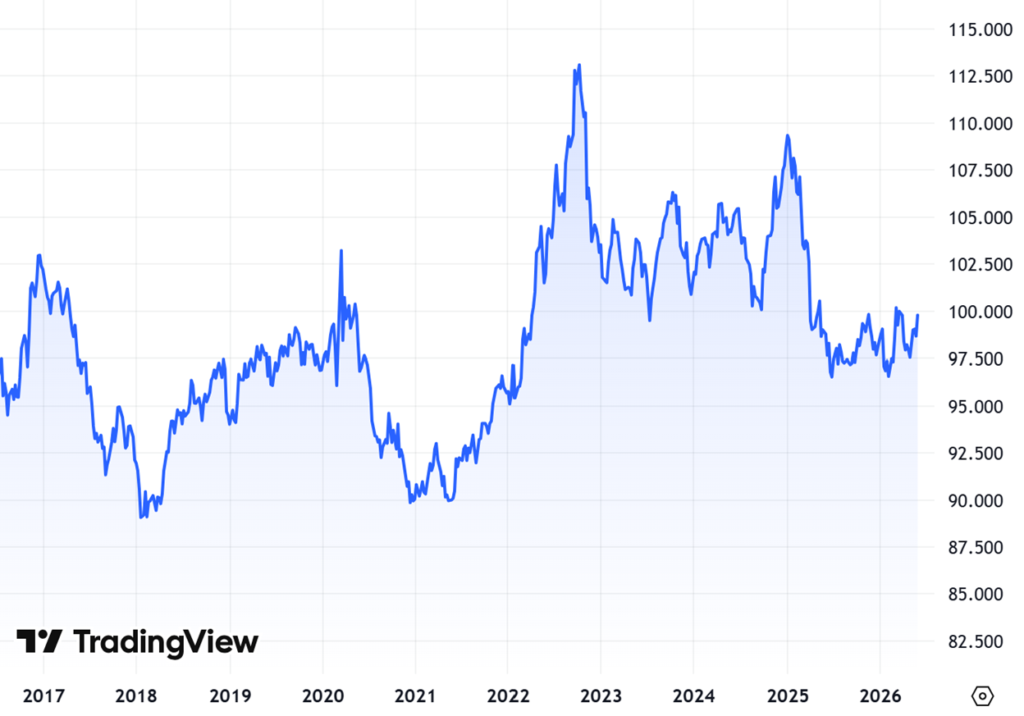
U.S. Dollar
The U.S. Dollar Index continues to trade within a range, roughly between 95 and 100. As U.S. interest rates have moved higher, the dollar has generally risen alongside them as elevated yields attract foreign capital. From a purely technical perspective, the U.S. dollar may need to cleanly break out of this range before any meaningful directional move occurs.
HIGH INCOME

I remain moderately bullish on high income-generating assets.
I prefer broad diversification across credit-sensitive bonds, dividend growth companies, option income strategies, and closed-end funds.
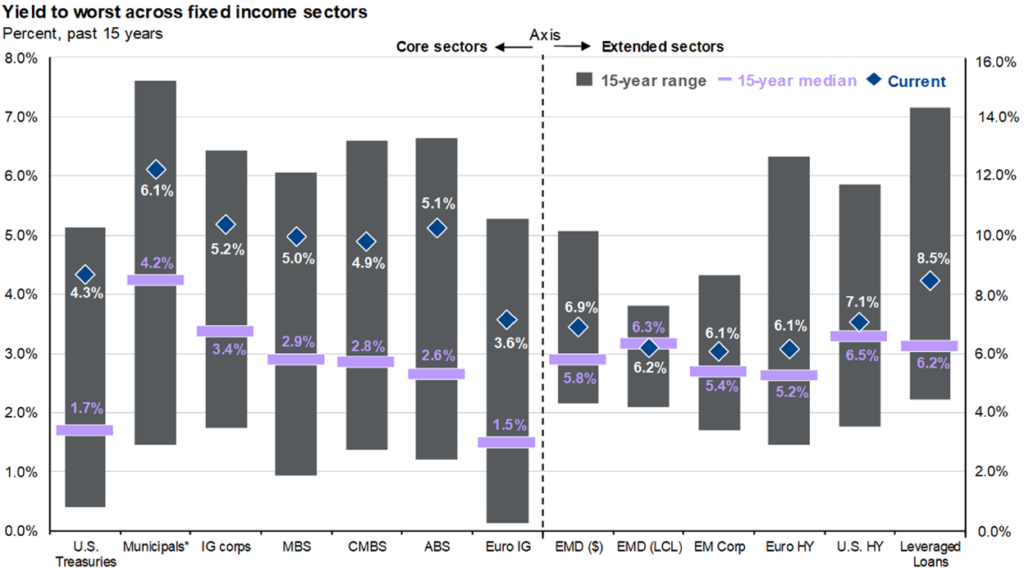
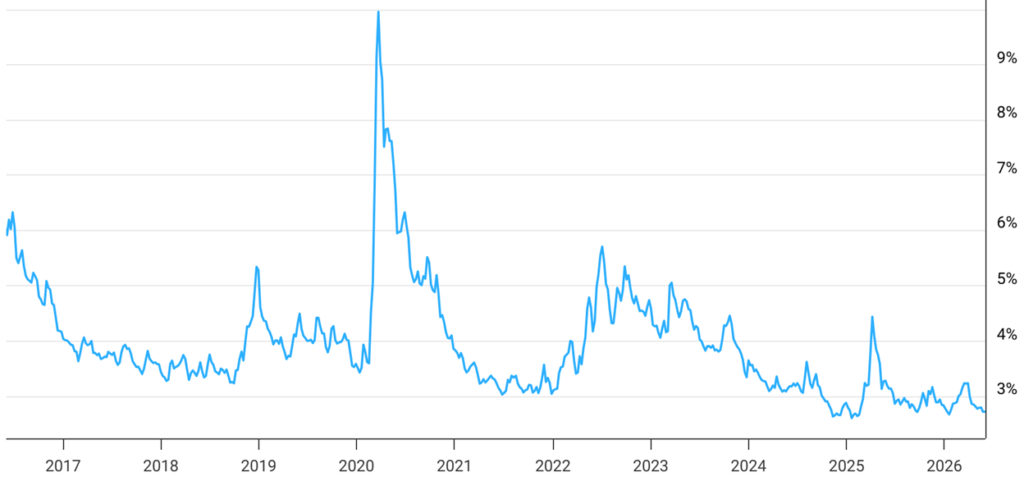
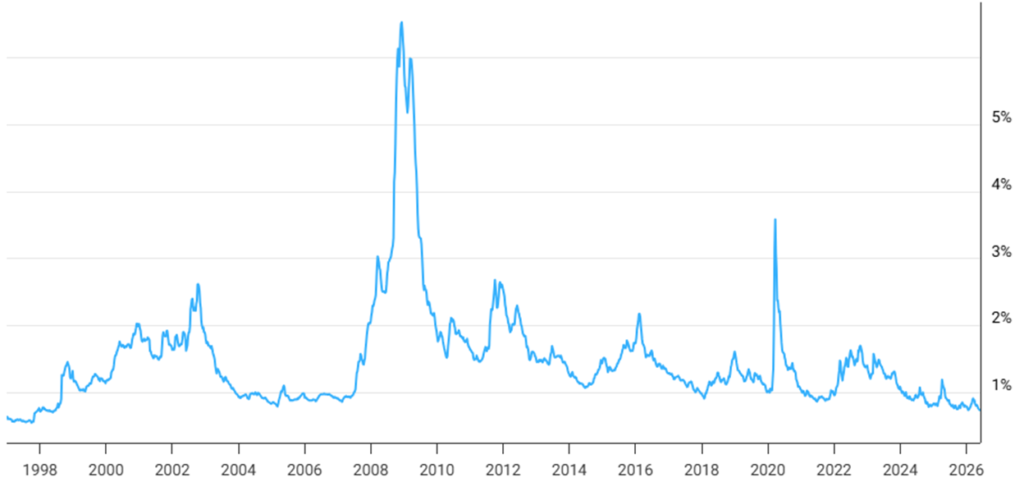
Absolute yields across credit-sensitive bonds remain attractive, generating yields above 5%, although credit spreads are currently tight. In an environment where future equity returns may be muted following the significant returns tied to companies in the artificial intelligence infrastructure buildout, the potentially less volatile returns from credit sensitive bonds could be a ballast to a diversified, multi-asset portfolio.
High Yield Spreads
I also like dividend growth strategies, which could continue to expand their opportunity set. For example, NVIDIA recently announced a significant increase in its dividend payout. If other major technology and growth companies follow this trend, securing rising income through exposure to fundamentally strong businesses could be an attractive and sustainable investment opportunity.
Option income strategies continue to look attractive, with some strategies providing yields of 8% or more depending on the specific strategy. These strategies can also potentially provide downside protection. If broader market volatility suddenly jumps, the underlying value of those option positions could increase, which could help provide some protection.
Closed-end funds remain attractive to me from a long-term total return perspective, but the issue I have is that current average discounts of closed-end funds to their underlying net asset values are relatively tight. With these discounts to NAV currently narrow, I do not want to be materially overweight in the closed-end fund space at this time.
COMMODITIES

I remain slightly bearish on commodities.
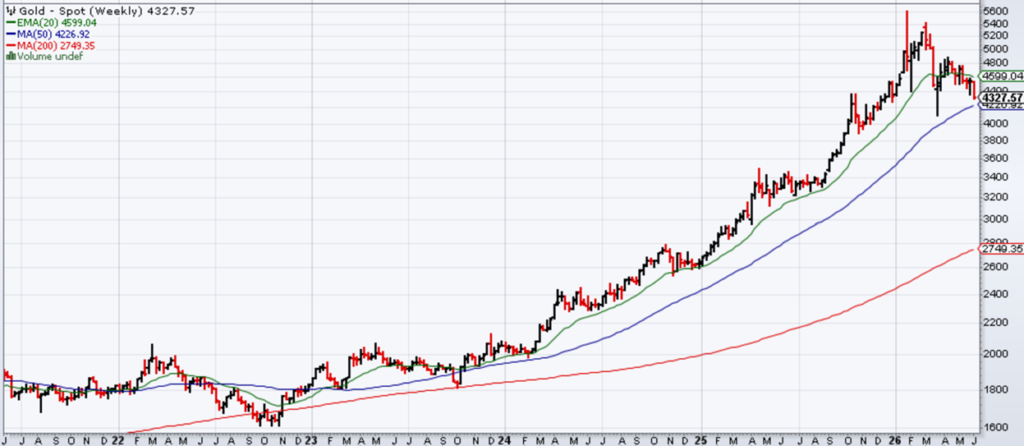
In my previous Outlook and Positioning update in March, gold was trading near $5,100 per ounce. It has since declined to roughly $4,500 per ounce. Meanwhile, West Texas Intermediate crude oil was trading around $90 per barrel during that same period, which is close to where it is hovering today despite ongoing geopolitical tensions and supply fluctuations.
Gold
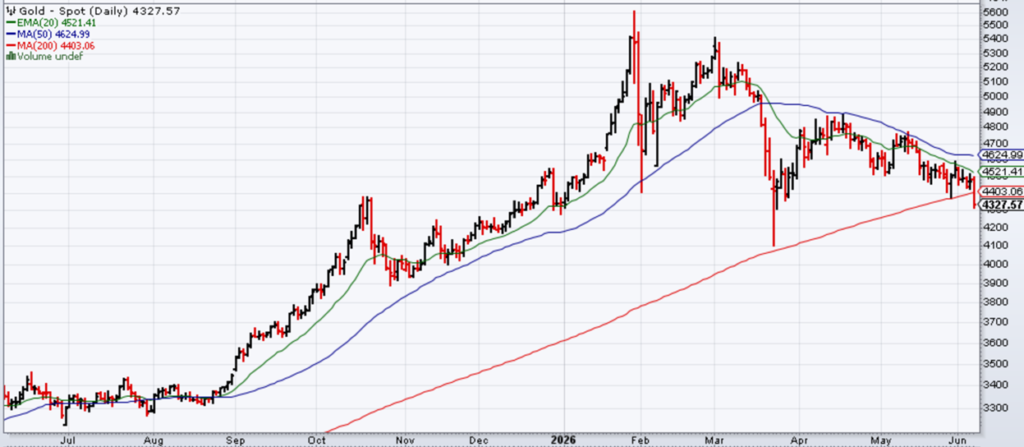
In my March update, I stated that gold was trending positively from a technical perspective. I also cautioned that if the price fell below its 50-day and 200-day moving averages, my stance would become increasingly bearish. In mid-March, gold broke below its 50-day moving average, which had been support for several months. Gold continued to grind lower and broke below its 200-day moving average on June 5th.
If gold cannot reclaim and sustain above its 200-day and 50-day moving averages, gold could accelerate to the downside. The next major technical support level appears to be around $3,900 to $4,000 per ounce, which would need to hold. Otherwise, gold could experience an even deeper decline.
Gold – Daily Chart
Gold – Weekly Chart
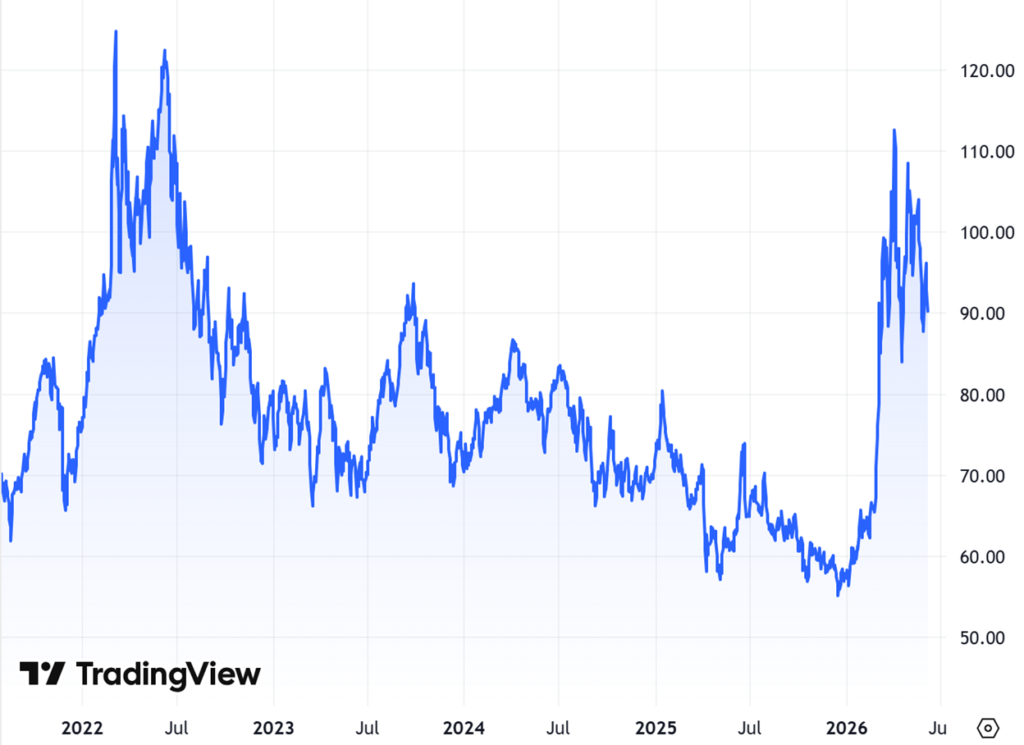
WTI Crude Oil
West Texas Intermediate crude oil is trading at roughly $92 per barrel as of June 4, 2026. Energy prices remain highly sensitive to the ongoing geopolitical conflict between the U.S. and Iran. This has kept a risk premium in the oil market due to supply disruptions across the Middle East. Global oil inventories and storage levels continue to decline. If physical supplies remain constrained over the coming months, the market faces the risk of a sudden price spike.
I don’t think WTI crude oil would be able to sustain levels above $100 per barrel for an extended period. The U.S. and Iran have significant economic and political incentives to avoid prolonged escalation and the damaging effects of high energy prices. I think a diplomatic resolution will eventually prevail, which could allow oil prices to decline from here.
For these reasons, I remain slightly bearish at current levels, but if oil spikes, I would likely become increasingly bearish.
WTI Crude Oil

CONSERVATIVE ASSETS
I have increased my bullishness on conservative assets as interest rates have moved higher. Since corporate credit spreads remain relatively tight, my increasingly bullish view is on U.S. government bonds rather than investment grade credit.
Kevin Warsh was recently appointed Chairman of the Federal Reserve, replacing Jerome Powell. While President Trump has indicated his desire for lower interest rates, sticky inflation complicates the macroeconomic picture. Even Chairman Warsh may find it difficult to execute rate cuts while elevated price pressures persist.
Longer-term, if inflation subsides, interest rates could decline from current levels. The major wildcard remains the rapidly increasing U.S. national debt. Bond investors may demand higher yields to compensate for the risks associated with this massive deficit spending. This structural concern could establish a floor under interest rates, preventing them from falling significantly and keeping long-term borrowing costs elevated.
U.S. GOVERNMENT BONDS
As the U.S. Treasury yield curve has shifted higher, I have become moderately bullish on U.S. government bonds and would increase exposure to Treasury duration at current elevated levels.
Over the next few years, I anticipate that the massive capital spending on the artificial intelligence infrastructure buildout could slow down. I also believe energy markets could stabilize, and oil prices could potentially decrease from their current levels. Both of these developments could translate into lower inflationary pressures across the broader economy.
If inflation cools, it could put downward pressure on the yield curve because the Federal Reserve may have the flexibility to resume interest rate cuts. If the broader market believes that a steady path of rate cuts is on the horizon over the next few years, the entire yield curve could shift lower. Since the prices of interest rate-sensitive bonds move in the opposite direction of interest rates, this shift could cause the prices of existing bonds to rally.
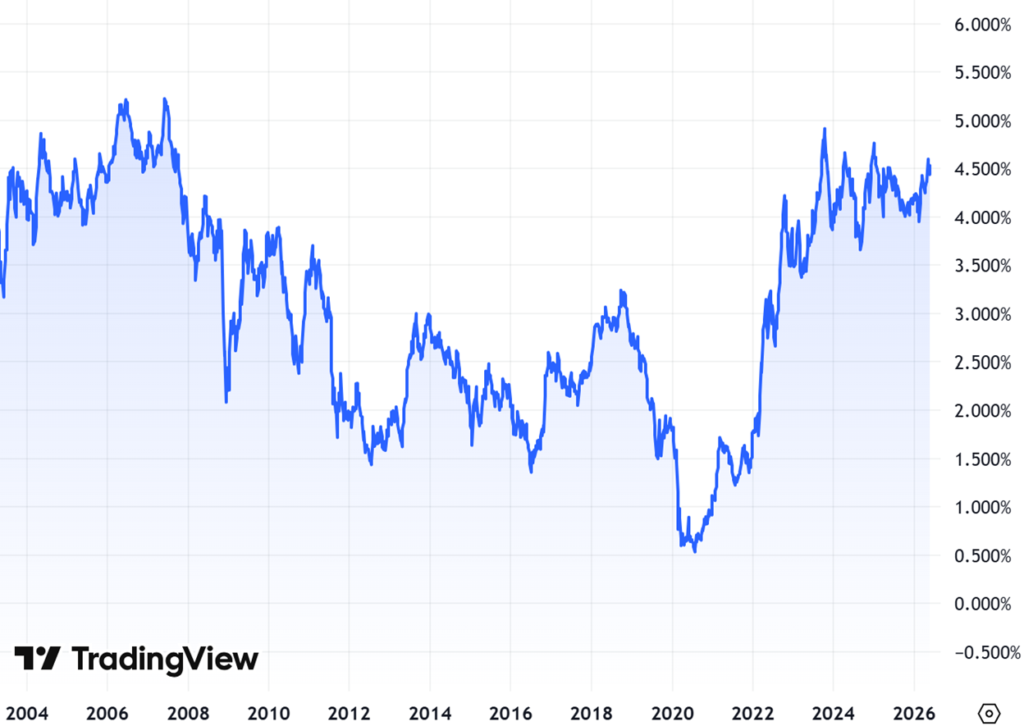
Looking at the 10-year Treasury yield, the 5% level has been the upper end of its range over the past couple of years. As the yield approached the 4.5% to 5.0% level, I became increasingly bullish on Treasuries. If the yield falls to the 4% level and below, I would be less bullish.
U.S. 10-Year Treasury Yield
U.S. INVESTMENT GRADE CREDIT
I am only slightly bullish on investment grade credit.
Investment grade credit spreads remain historically tight in the current market environment. With the yield premium so narrow, investors are receiving limited compensation for assuming additional corporate credit risk.
From the perspective of managing conservative assets, I don’t have a need to be overly aggressive with corporate credit exposure right now. The current macroeconomic environment is supported by solid corporate earnings but also includes lingering inflation and geopolitical concerns.
In this environment, I prefer to wait for the fixed income market to come to me and for credit spreads to widen before considering a more aggressive allocation to corporate credit within a conservative bond allocation.
U.S. Corporate Bond Spreads
OTHER
I use this section to talk about other potential strategies, generally whether or not hedges are needed on asset classes.
I remain slightly bullish on hedged strategies at this time. Because economic and corporate earnings growth are widely expected to continue, adopting an overly bearish position in the current environment doesn’t make sense to me. If I were hedging anything, it would be the artificial intelligence-related stocks that have run up exponentially.
Rather than utilizing alternative strategies for hedges, I prefer allocations to lower-volatility, traditional asset classes like multi-asset income strategies and high-quality bonds.
For conservative investors actively seeking downside protection, utilizing structural options-based hedges is an area to consider. These hedges utilize financial contracts to establish a predetermined floor. I prefer this approach over algorithmic trend-following strategies, particularly as they may be subject to a trend reversal in this market environment after the persistent move higher in equities that we’ve seen. In a choppy and volatile market environment, trend-following strategies can easily get whipsawed and generate rapid consecutive losses as they buy and sell into false price signals.
IMPORTANT DISCLOSURES
The opinions voiced in this material are for general information only and are not intended to provide or be construed as providing specific investment advice or recommendations for any individual security.
Any economic forecasts set forth in the presentation may not develop as predicted and there can be no guarantee that strategies promoted will be successful.
The terms “portfolios” or “strategies” used in this piece may be in reference to the Intrua Financial model portfolios. Any reference to performance is based on estimated, unaudited, gross of fee performance of the model portfolios. Model portfolio performance is calculated through Morningstar Direct based on model portfolio holdings. Client accounts assigned a Intrua Financial model portfolio may have positioning and performance that differs from the firm’s model portfolios at any given time.
There is no assurance that the techniques and strategies discussed are suitable for all investors or will yield positive outcomes. The purchase of certain securities may be required to affect some of the strategies. Investing in stocks includes numerous specific risks including: the fluctuation of dividend, loss of principal and potential illiquidity of the investment in a falling market.
Bonds are subject to market and interest rate risk if sold prior to maturity. Bond and bond mutual fund values and yields will decline as interest rates rise and bonds are subject to availability and change in price. Government bonds and Treasury bills are guaranteed by the U.S. government as to the timely payment of principal and interest and, if held to maturity, offer a fixed rate of return and fixed principal value. However, the value of fund shares is not guaranteed and will fluctuate.
Investing in stock includes numerous specific risks including: the fluctuation of dividend, loss of principal, and potential illiquidity of the investment in a falling market.
Asset management does not ensure a profit or protect against loss. There is no guarantee that a diversified portfolio will enhance overall returns or outperform a non-diversified portfolio. Diversification does not protect against market risk.
The fast price swings in commodities will result in significant volatility in an investor’s holdings. Commodities include increased risks, such as political, economic, and currency instability, and may not be suitable for all investors.
Precious metal investing involves greater fluctuation and the potential for losses.
Alternative investments may not be suitable for all investors and should be considered as an investment for the risk capital portion of the investor’s portfolio. The strategies employed in the management of alternative investments may accelerate the velocity of potential losses.
International investing involves special risks such as currency fluctuation and political instability and may not be suitable for all investors. These risks are often heightened for investments in emerging markets.
Intrua Financial, LLC is an SEC-registered investment adviser. Registration does not imply a certain level of skill or training.

Eric Kulwicki, CFA®, CFP®, brings 20+ years of experience, currently serving as an independent investment consultant, portfolio manager, and wealth advisor for institutional and retail clients. On KulwickiInsights.com, Eric shares his timely perspectives on financial markets, investment strategies, and other financial topics. He also offers online investment education courses for beginner and intermediate investors, and coaching sessions for DIY investors seeking professional guidance.