
SUMMARY
- U.S. Equities: I remain cautiously bullish on U.S. equities, favoring high-quality, growing companies even as large cap valuations look stretched. Performance could broaden to mid and small caps if the economy remains firm without higher inflation, the Fed signals rate cuts, and key technical levels are broken to the upside. For valuation-sensitive investors like myself, pullbacks that bring valuations closer to historical averages could present attractive entry points. Increased caution would be warranted if economic growth weakens meaningfully while inflation remains sticky.
- International Equities: I remain moderately bullish on foreign equities, favoring geographic, market cap, and style diversification with a focus on higher quality, growing companies. Despite their strong performance this year, valuations still appear attractive relative to U.S. large caps, though less compelling compared to high-quality U.S. mid and small caps. Currency moves have been a key driver, and while further dollar weakness could support foreign markets, a reversal in the dollar upward would be a headwind. Tactically, I’m maintaining leveraged exposure to emerging markets and Chinese equities, but I would consider reducing these positions if valuations tighten or price targets are met.
- High Income-Generating Assets: I remain moderately bullish on high income assets and strategies, with a preference for actively managed strategies, with exposure to global dividends, option income, credit-sensitive bonds, emerging markets debt, securitized bonds, tactical income, and closed-end funds. With equity valuations stretched, income-generating strategies could generate attractive income while providing diversification and potential downside protection. I am more cautious on closed-end funds given their tighter discounts to net asset values, but continue to like the flexibility of tactical multi-asset income strategies that can adapt to different market environments.
- Commodities (Gold & Oil): I remain slightly bullish on commodities overall and continue to rely on market technicals to guide my outlook. For gold, the breakout above short-term resistance and support from the 200-day moving average keeps me constructive, though I would turn more cautious if prices fall back below these levels. Oil remains range-bound, but with WTI Crude Oil currently near the bottom of its long-term $60–$90 per barrel range, oil could rebound higher within that band. While supply remains ample and demand uncertain, a pickup in global growth or renewed geopolitical tensions could provide additional upside for oil.
- Conservative Assets (Bonds): I have reduced my outlook on bonds from moderately bullish to slightly bullish as yields have fallen and credit spreads tightened. Bonds have performed well this year, supported by income generation and price appreciation, but with the 10-year Treasury yield sitting near 4% in the middle of its recent range, I see more limited upside unless inflation declines further or the Fed signals rate cuts. I remain slightly bullish on both Treasuries and investment grade credit, though I prefer diversified, actively-managed bond strategies that can adjust across sectors, quality, and duration. Given tight spreads and lingering macro risks, I prefer maintaining higher-quality bond exposure as a portfolio ballast and diversifier against equity risk.
- Other (Hedges): I remain slightly bullish on non-traditional investment strategies, as I am more neutral on overall risk positioning given elevated equity valuations. Rather than leaning on complex hedging or tactical sector rotation approaches, I prefer allocating to multi-asset income and credit-sensitive bond strategies that continue to provide attractive yields. For more cautious investors, hedged equity strategies could provide a way to participate in markets with downside protection. On the bond side, hedged credit strategies that can reduce broad credit market exposure while targeting idiosyncratic opportunities also make sense in the current environment.
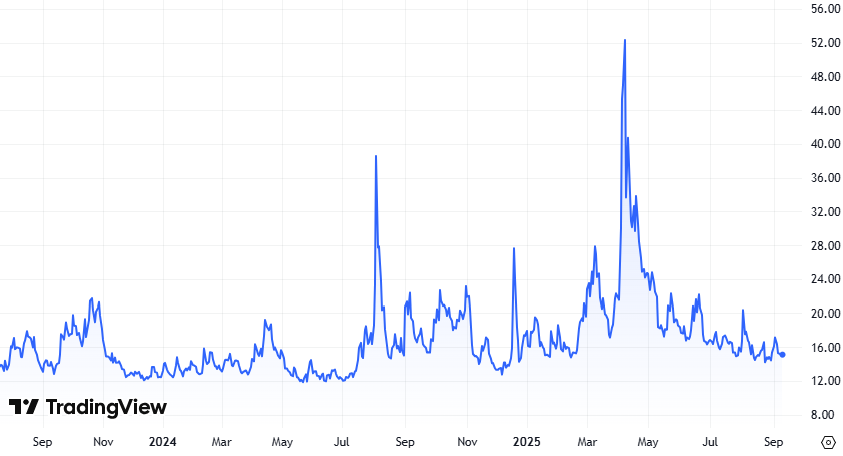
Since my last Outlook & Positioning piece on June 9th, the global equity markets continued to move higher and bond prices have rallied in addition to generating attractive income. As you can see in the chart below, volatility as measured by the S&P 500 Volatility Index (VIX) has declined from its spike in March and April around President Trump’s tariff announcement.
Investors appear to have made a 180-degree turn from that period of volatility and have been embracing risk again. Those investors that had concerns about the strength of the artificial intelligence movement and sold off tech-related stocks in March and April, must have quickly realized the AI trade was alive and well as these AI-related stocks rallied hard from the April bottom.
For those of us that took advantage buying the risk asset selloff in March and April, we have been rewarded. Throughout the rally from the lows, I have been methodically reducing risk exposure in my tactical portfolios as my price targets are reached.
S&P 500 Volatility Index (VIX)
Since my last Outlook & Positioning piece in June, President Trump’s “One Big Beautiful Bill” was passed, locking in and extending a number of tax cuts originally implemented in 2017. While many investors were anticipating this bill to pass, it did remove an item of uncertainty from investors’ minds.
Tariffs were also an important factor that investors needed clarity on. Months have now passed since President Trump’s “Liberation Day” announcement on April 2nd and subsequent 90-day pause announcement on April 9th. From that 90-day pause, in addition to new trade/tariff deals announced with different countries, equity markets and other risk assets have rallied significantly. The S&P 500, NASDAQ and Dow Jones Industrial Average equity indices now reached new all-time highs. It’s been quite a reversal from the April lows.
Tariffs have again come under additional uncertainty as lower-level federal courts have ruled the tariffs unconstitutional. President Trump’s administration is pushing for the Supreme Court to hear an appeal on the case sooner rather than later. We are now again in a holding period of uncertainty for tariff policy.
If the tariffs are considered unconstitutional by the Supreme Court, there may be a rebate of tariffs already paid. This could potentially be a short-term positive for companies that have already paid them and potentially bullish for equities. I would assume following that ruling, President Trump and the Republican-majority Congress will push to try to enact these tariffs into law, but that might take a while. If the tariffs are upheld by the Supreme Court, then nothing has really changed from my perspective. We also still haven’t had a concrete trade deal with China yet either, with continued extensions from President Trump pushing deadlines for an agreement out further.
From a U.S. economy perspective, inflation remains somewhat stable in the high 2% to low 3% range, earnings growth continues to be generally in line with expectations and the unemployment rate remains at the lower end of the historical range.
There are some signs of potential weakening in the labor market as recent jobs numbers have come in softer than expected. The Fed is sensitive to the health of the job market, in addition to keeping inflation in check. Investors will continue to monitor the job market to help determine if the economy has the potential to slow at a quicker and deeper pace than previously anticipated. If hiring remains sluggish, the Fed may have more incentive to cut interest rates to try to get ahead of the broader economy from slowing further.
U.S. Job Growth by Month
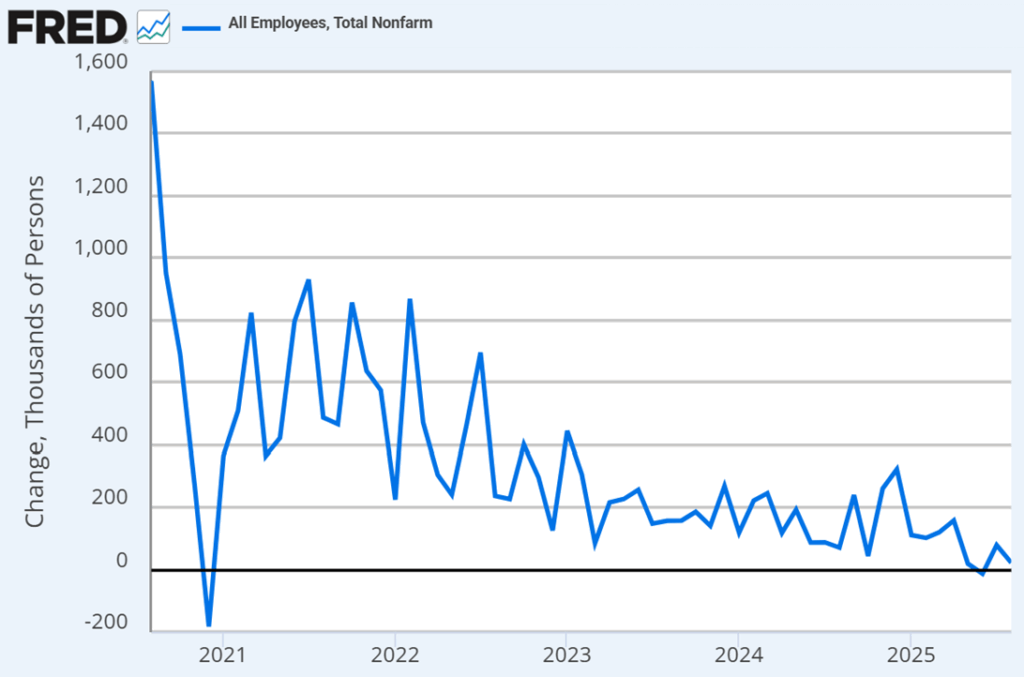
In our current moderate growth environment that may have some signs of slowing, investors are anticipating rate cuts by the Fed before the end of the year, with a potential cut as early as the Fed’s September 16-17 meeting. With the fed funds rate target currently at 4.25-4.50%, and as long as inflation doesn’t spike to mid- to high- 3%, there appears to be ample “dry powder” for the Fed to cut interest rates if needed. I think the potential for Fed rate cuts could be enough to keep a floor under risk assets for now, even as equity and credit valuations appear a bit stretched.
From my perspective, if risk assets continue to rally, I’ll continue to reduce my select overweights to risk assets to more of a neutral positioning. I have plenty of “drier powder” to put to work if volatility picks up again and risk assets experience a material downswing.
As always, I’ll keep focused on the longer-term and let the market come to me.
My Tactical Adjustments
If you read my last Outlook & Positioning piece back in June, I stated that I had increased exposure to risk assets during the equity market decline, and started to take profits following the big rebound from the lows. Since then, I’ve continued to do the same, just taking profits in areas that continued to rally and rebalancing positions back to their strategic targets. Keeping it simple. At least for me, simple works.
Throughout June, July and August, I was specifically reducing leveraged exposure across a number of areas, including U.S. large caps, emerging markets, and dedicated positions in semiconductors, China and biotech. This allowed me to take some profits in select areas that I added to during the equity market decline in March and April.
I didn’t make any adjustments with allocations to multi-asset income or bonds as the income generation remains attractive and these areas remain a solid complement to my exposure to higher volatility equity positions.
Valuations in U.S. large cap equities appear a bit stretched, but mid/small caps and international equities still seem attractive enough for me to have a good amount of exposure in these areas. If mid/small caps and emerging markets continue to rally higher, I would consider reducing my leveraged exposure to these areas. We are somewhat close to my target price levels, but not quite there yet.
The image below is the exchange traded fund that tracks the MSCI ACWI Index, an index that tracks the performance of stocks from developed (U.S. and foreign) and emerging countries around the world. This is just a simplified illustration of how I added exposure to risk assets throughout the downturn and have been reducing exposure to risk assets as the markets rallied. My increased/reduced exposures were across leveraged U.S. and international equity positions as already described in this posts and my previous posts on Kulwicki Insights.
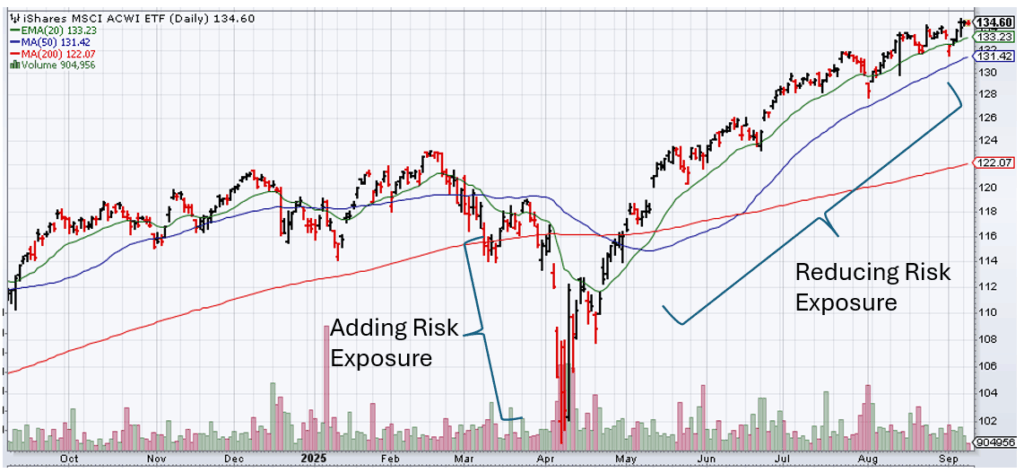
At least this time around, buying lower and selling higher seems to have worked out so far. We’ll just have to wait and see what the markets give us from here. As always, I highly suggest that you have an investment plan before the markets move one way or another. If/when the markets move, you’ll know how to execute your investment plan accordingly, and hopefully, without emotions getting in the way.
RISK ASSETS

I maintain a slightly bullish view on risk assets at this time.
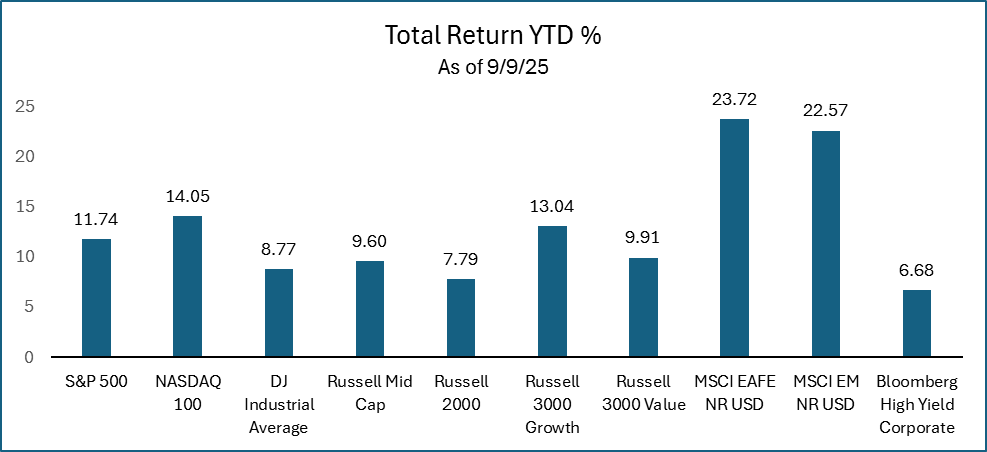
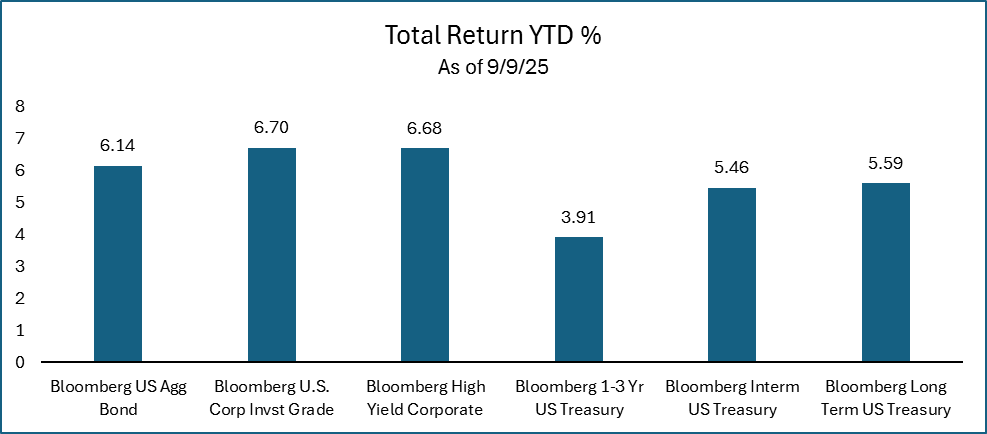
Risk assets continued to perform well, with U.S. and international equities and high yield bonds generating strong returns year-to-date. Those investors that have been diversified into international equities this year have been rewarded. The outperformance of international equities relative to U.S. equities has been welcomed after materially underperforming U.S. equities for several years.
When looking at valuations across the world following the outperformance of foreign equities relative to the U.S. this year, foreign equity market valuations have moved higher relative to their earnings growth. This means investors are now paying a higher valuation per unit of earnings.
As you can see from the chart below, valuations outside of the U.S. have extended higher than what they were at the beginning of the year. You’ll also notice that these foreign equity markets’ valuations still remain at a discount to the U.S., potentially continuing to provide an opportunity for valuation-conscious investors.
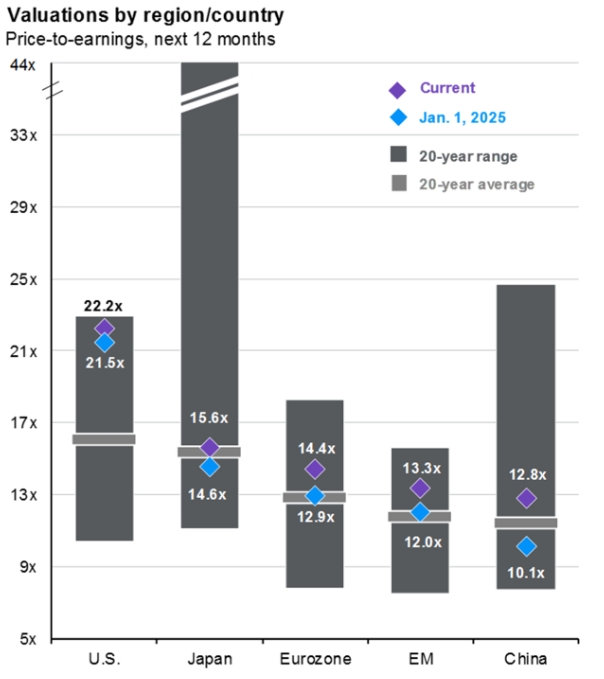
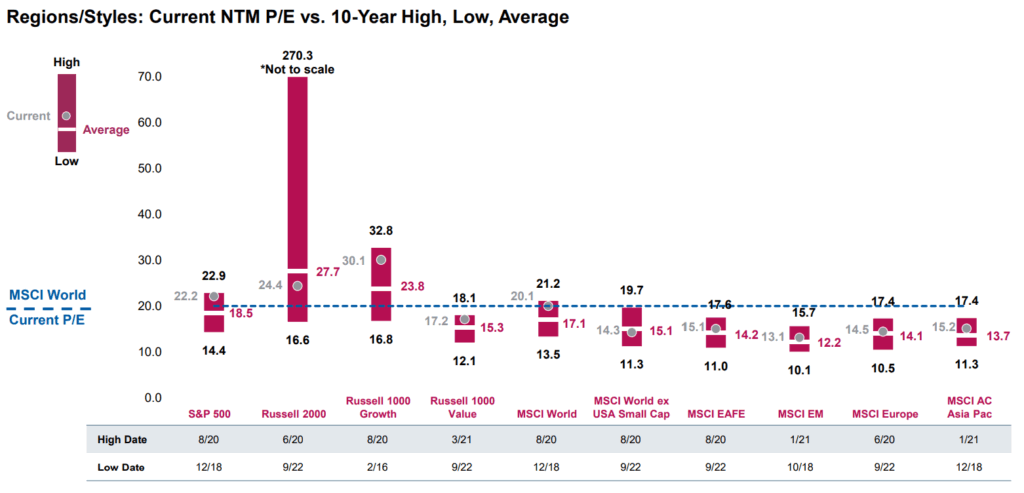
Below is a more detailed view of valuations across areas in the U.S. and foreign equity markets. As you can see, valuations throughout the world appear to be at or above their 10-year averages by style, market cap and region. Although foreign markets still trade at a discount to the U.S., they are now roughly at or above their own 10-year average valuation. This could be a negative factor for investors to consider.
Remember, valuations aren’t the only thing to consider. Earnings growth and the quality of those companies are also very important. A lower valuation company that doesn’t grow might be less attractive than a higher valuation, higher quality company that is growing at a faster rate. Like many things, you sometimes have to pay up for quality. The question for investors is how much of a valuation premium is too much?
If we look at earnings growth expectations for next year in the U.S. and internationally, growth is anticipated to be pretty solid. You can see the earnings growth expectations in the chart below.

If investors believe earnings growth can continue next year, and maybe even accelerate, investors may continue to support global equity markets. Investors often position their portfolios today for what they believe could be the potential in the future, so some of the strong equity performance this year could be due to an anticipation of solid earnings next year. A bullish earnings environment for 2026 at least provides a reason for investors not to become overly bearish. This could keep a floor under global equity markets as we continue to move forward through year end and into next year.
High income-generating assets also remain attractive, particularly relative to pure equity exposure. Below investment grade high yield bonds, emerging markets debt and credit-sensitive securitized bonds provide opportunities for income yields of over 6%, which is attractive to me.
Closed-end funds are one area within this space that I’m more cautious on. Closed-end funds often utilize leverage to try to enhance returns/income, but that leverage can also increase volatility. On average, closed-end funds appear to be trading at tighter price discounts to their net asset values (NAVs) compared to historical averages. The tight discounts to NAVs, tight credit spreads and elevated equity valuations is pushing me to have a bit more conservative view on closed-end funds. I haven’t made any adjustments to my allocation to closed-end funds, but if valuations continue to grind tighter and become less attractive, I may reduce that exposure and reallocate to non-leveraged multi-asset income strategies.
In summary, with valuations in U.S. large caps hitting new highs and valuations are extended again, I’m less interested in being overly aggressive in U.S. large caps. I continue to prefer to remain diversified across higher quality companies’ equities in the U.S. and internationally, with additional diversified exposure to diversified higher-income generating assets.
I think this allocation approach provides me adequate equity exposure if global equity markets continue to grind higher. If equity markets stall out and just chop around, higher income-generating assets can provide some additional source of return through income. If some sort of unexpected catalyst hits the equity markets and markets decline, I can source additional capital from lower volatility income-generating assets and increase risk exposure to equity markets. If we experience a deeper equity market decline, I would consider adding additional leveraged equity exposure as I did in March and April.
As always, I’m just going to remain patient and let the markets come to me.
U.S. EQUITIES
I remain slightly bullish U.S. equities at this time. Although U.S. large cap valuations have become extended again, I prefer to remain allocated to higher quality, growing companies across market cap and investment style (growth, core, value).
U.S. large cap indices (S&P 500, NASDAQ 100, Dow Jones Industrial Average) reached new highs since my last Outlook & Positioning piece in June. Those investors that either added exposure to U.S. equities during the downturn or just stayed the course, were rewarded.
Valuations in U.S. large caps have become extended again, which can be a short-term issue, particularly for valuation-sensitive investors.
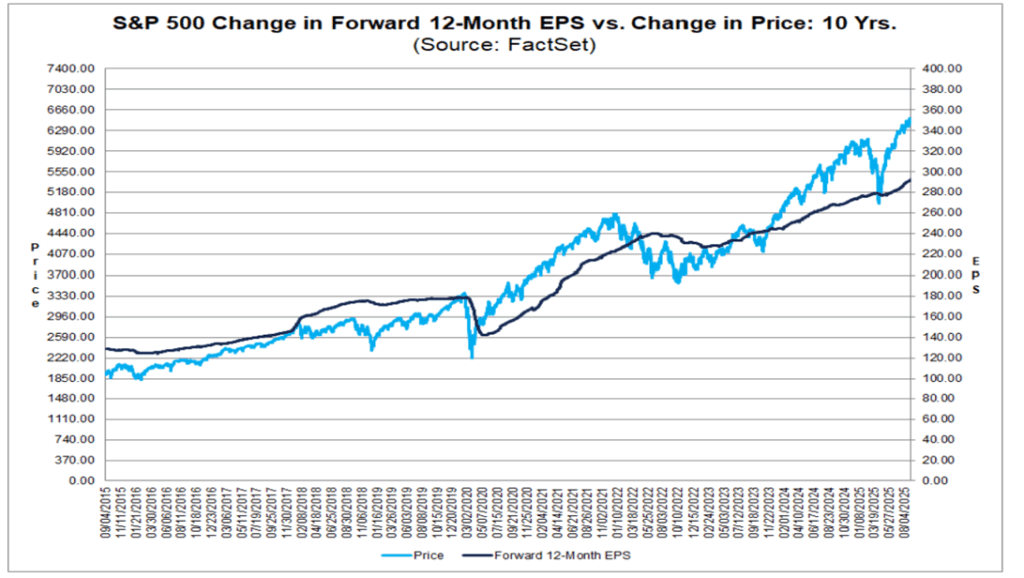
In the chart below, if you compare the 12-month forward earnings per share (EPS) growth (dark line) of the S&P 500 Index compared to the price (blue line) of the S&P 500 index, you can see that the valuation (blue line) has accelerated faster and higher than the earnings growth estimates. If you go back to April, you can see when valuations were more palatable as the light blue line (price) touched the darker line (EPS). If you go back further, you’ll see periods where price was below EPS, which could have been an indication that U.S. equity valuations were attractive.
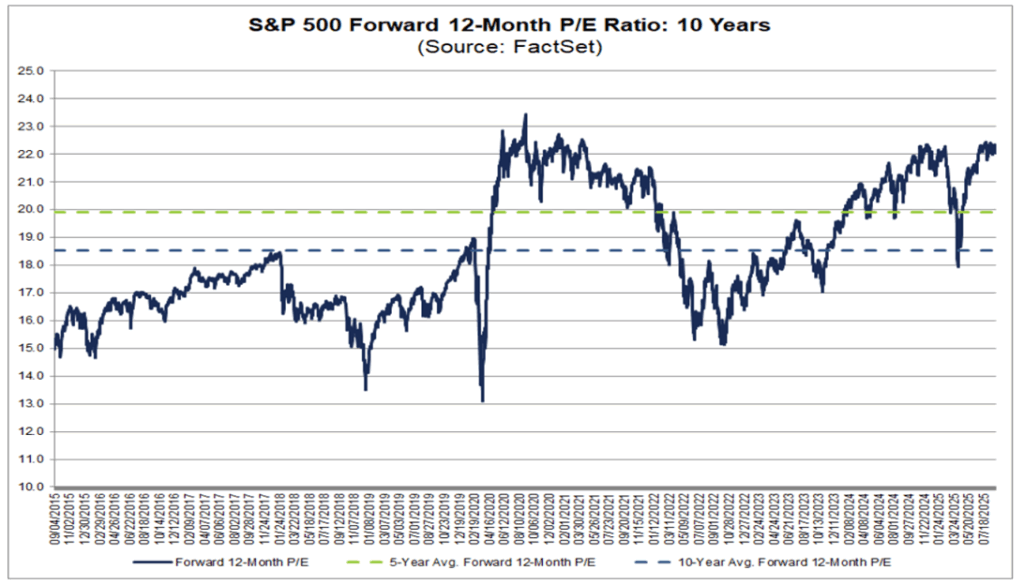
Looking at it another way, in the chart below, the forward price-to-earnings (P/E) ratio looks elevated relative to the last 5- and 10-years. Back in April, you can see that after the market decline, the forward P/E ratio hit the 10-year average. At those more attractive valuation levels, investors may have stepped in to buy, resulting in the subsequent rally from the April lows. Valuation-sensitive investors that were patiently waiting for those improved valuations to buy, were rewarded.
A good portion of the performance of U.S. large cap indices has been due to the strength of the “Magnificent 7” companies’ stocks. The Magnificent 7 are Alphabet, Amazon, Apple, Meta Platforms, Microsoft, Nvidia, and Tesla. As you can see below, this group of stocks have materially outperformed the rest of the stocks in the S&P 500 since the beginning of 2021.
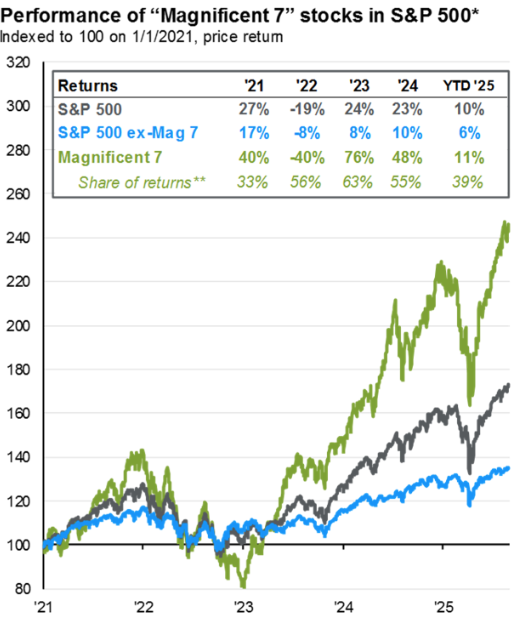
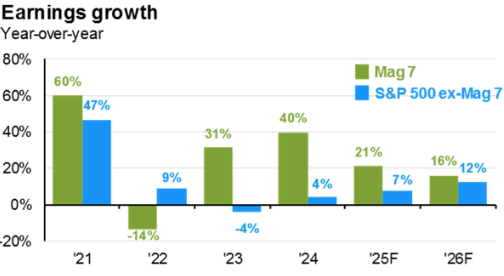
This outperformance of the Mag 7 is tied to these companies’ earnings growth relative to the rest of the companies in the index, so the outperformance may be warranted. If you look at the chart below, the spread between the earnings growth of the Mag 7 and the rest of the S&P 500 index has been declining. It remains to be seen whether this trend will continue, but if it does, maybe stock performance will broaden out and non-Mag 7 stocks could outperform.
While large caps appear somewhat concentrated in performance due to the Magnificent 7, mid and small caps appear more reasonable and less loved. Small caps have been trailing large and mid caps this year as uncertainty on U.S. policy, the Fed and geopolitical tensions persist. Investors often prefer more clarity to fully embrace the potentially more risky and volatile small cap stocks.
Looking at the chart below, you can see how small cap ETFs haven’t garnered significant interest from investors over the last 12 months. The chart indicates more outflows than inflows more recently, which may be a sign of investor concern. For contrarian investors, if small caps haven’t been appreciated by the market, if the market turns more bullish and investors are willing to take on more risk, the weakness in small caps could potentially turn to strength. If investors are underweight small caps due to selling the last several months due to uncertainty, if investors return with more clarity and want to take on riskier positions, small caps could outperform large caps going forward.
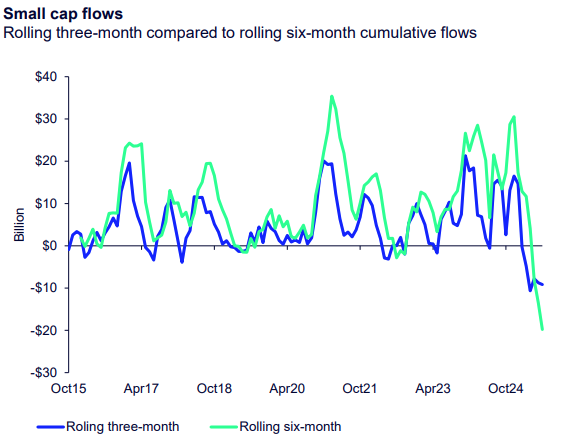
SPDR Chart Pack August 2025, data as of 7/31/25
Market Technicals
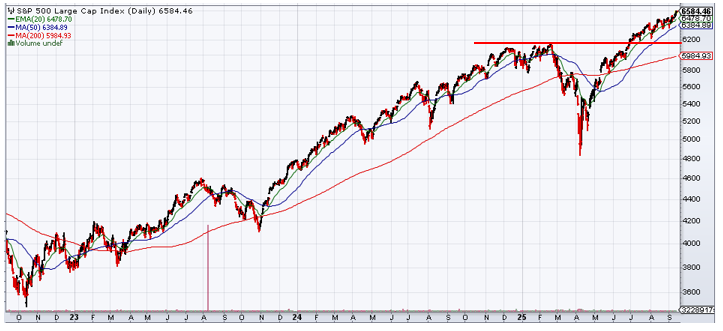
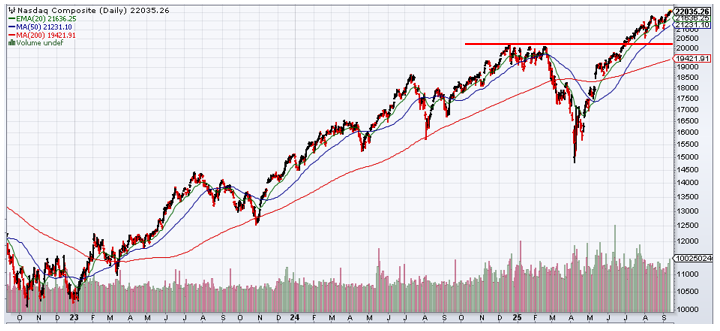
Market technicals have been strong, transitioning from weakness in March and April to more bullish since then. The U.S. large cap S&P 500 and Nasdaq 100 indices have led the charge higher, breaking through prior highs and rallying higher. As you can see in the charts below, the S&P 500 and NASDAQ 100 indices are trading above their prior highs (red line), but the S&P 500 Equal Weight, S&P Mid Cap 400 and Russell 2000 (small caps) indices have yet to break out to new highs.
From a technical trading perspective, for the S&P 500 and NASDAQ 100, the prior high (red line) now acts as support. For the S&P 500 Equal Weight, S&P Mid Cap 400 and Russell 2000 indices, their prior highs remain resistance that these indices need to break through. If they can break above their prior high resistance levels, these indices could take another leg higher, like the S&P 500 and NASDAQ 100 indices have done.
S&P 500 Index
For the S&P 500 Index, support remains at the prior highs, with a rising 200-day moving average (thin red line) below that providing additional technical support roughly 8% below current levels.
NASDAQ 100 Index
The NASDAQ 100 Index trades similar to the S&P 500, with the prior highs (thick red line) and a rising 200-day moving average (thin red line) below that.
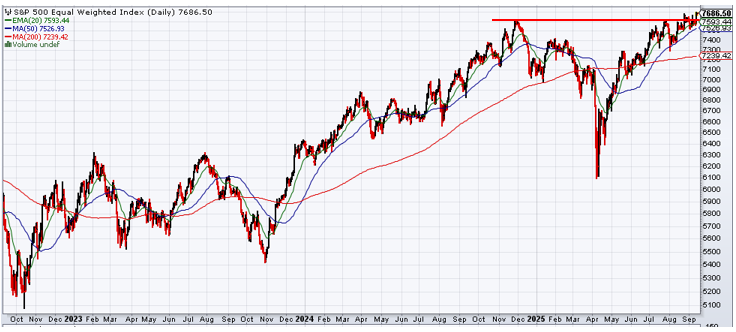
S&P 500 Equal Weighted Index
The S&P 500 Equal Weight Index does not have the benefit of a heavy weighting to the outperforming Magnificent 7 stocks that the market cap-weighted S&P 500 Index does. As the name indicates, the Equal Weight Index weights each stock equally in the index. As you can see in the chart below, the Equal Weight Index had been struggling up against the resistance level (thick red line) at its prior highs, but it may have an opportunity to break out above.
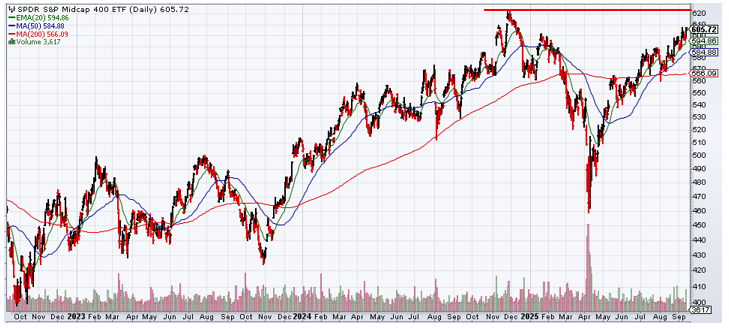
S&P 400 Mid Cap Index
The S&P 400 Mid Cap Index (proxied by the SPDR Portfolio S&P 400 Mid Cap ETF in the chart below) rallied strongly from its April lows but has yet to reach its prior high, which is currently its resistance level. If mid caps can break through to new highs, this would be considered a bullish development and a rally higher could continue.
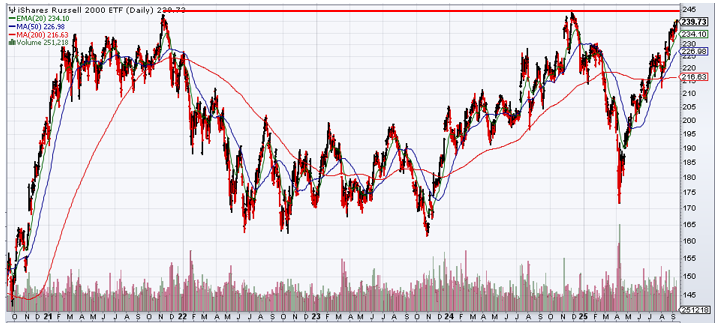
Russell 2000 (small cap) Index
The Russell 2000 Index, which measures the performance of U.S. small caps (proxied by the iShares Russell 2000 ETF in the chart below) is approaching its prior highs, which currently acts as technical resistance (thick red line). If the index can break above that resistance level going back to 2021, small caps could catch a stronger bid by technical traders and push small caps higher.
Overall, from a technical perspective, U.S. equities remain on a bullish path. Mid and small caps need to push above their prior highs and resistance levels to potentially trigger a push higher from technical traders. It may take stronger economic data and/or the Fed to signal rate cuts sooner rather than later to help support the move higher in mid/small caps. From a tactical perspective, if mid and small caps continue to move higher closer to their new highs, I will reduce my leveraged exposure to these areas in my U.S. Core X strategy that I manage.
FOREIGN EQUITIES

I remain moderately bullish on foreign equities at this time. I continue to prefer geographic, market cap and style diversification with a focus on higher quality, growing companies.
Foreign developed and emerging market equities have performed well this year, outperforming U.S. equity markets. Even with this outperformance, valuations in foreign equity markets remain attractive relative to U.S. large cap equities. Compared to higher quality U.S. mid and small caps company stocks, that valuation advantage is a bit less attractive at these higher foreign equity valuation levels.
Although foreign equity indices have rallied, a good portion of the rally has been driven by the appreciation in foreign currencies relative to a falling U.S. dollar. This indicates that not all of the performance of foreign equities was from multiple expansion on top of earnings, and that further multiple (valuation) expansion could continue, allowing foreign equities to push higher.
A slight concern for me is the rally that foreign currencies have had against the declining U.S. dollar this year. When speaking to other institutional investors, there doesn’t seem to be much conviction in the near-term direction of the U.S. dollar. I’m less confident that the dollar can decline at the magnitude it already has this year. If the dollar rallies from current levels, this could drag on foreign equity performance.
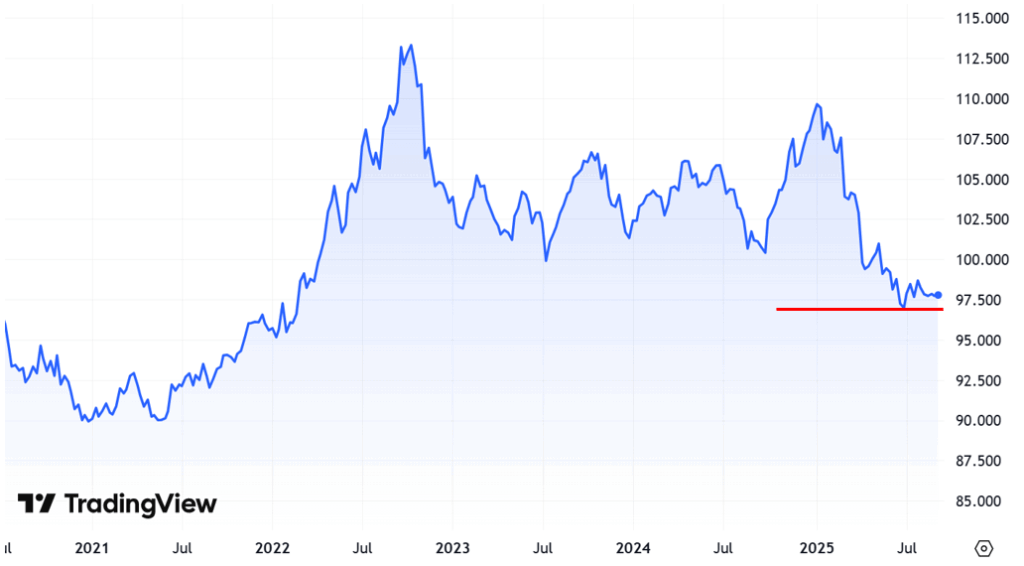
As you can see the falling U.S. dollar has already moved materially lower this year by about 10% through September 9th. Traders will be watching the current level of the U.S. Dollar Index. From a technical perspective, if the U.S. Dollar Index breaks below its recent support level (red line in the chart below), the dollar could take another leg lower. As has been the case this year, a falling U.S. dollar and corresponding rally in foreign currencies could be a benefit for investors in foreign assets.
U.S. Dollar Index
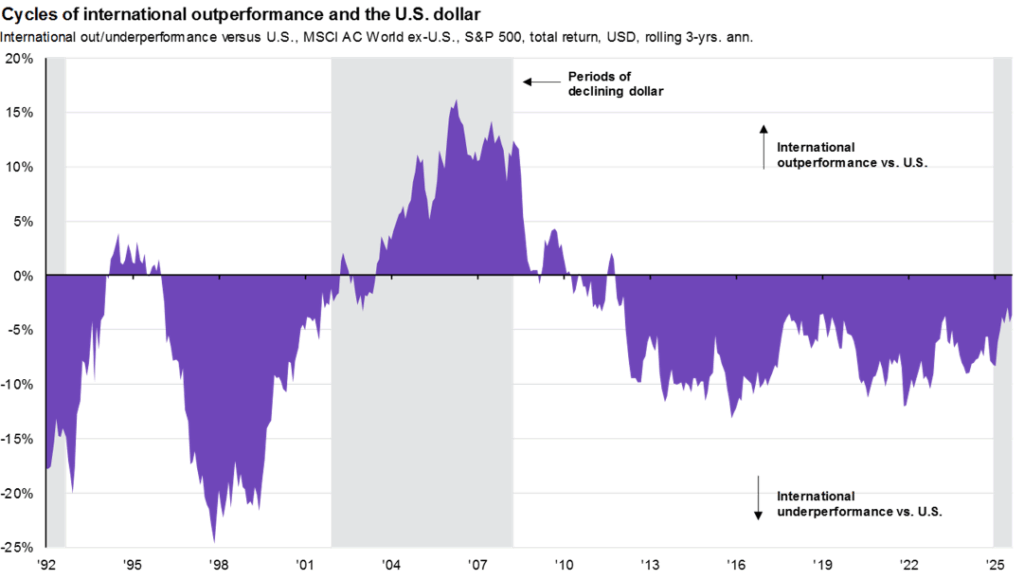
Historically, there have been periods where U.S. equity markets outperformed foreign equities, and vice versa. As you can see in the chart below, we have been in a period of U.S. dollar strength (foreign currency weakness) and U.S. equity outperformance (a good portion due to the strength of U.S. technology-related stocks). The question now is whether or not we are entering a more sustained cycle of foreign currencies and foreign stocks outperforming the U.S.
Let’s now take a look at the market technical of foreign equity markets…
MSCI EAFE Index
The MSCI EAFE Index (proxied by the iShares MSCI EAFE ETF in the chart below) remains in a bullish uptrend, with support levels at its breakout level from prior highs (thick red line) and with a rising 200-day moving average (thin red line).

MSCI Emerging Markets Index
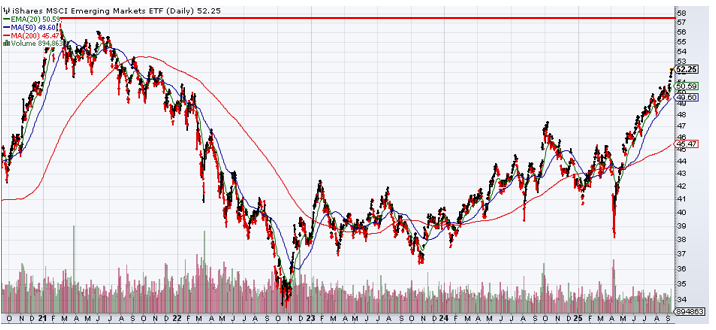
The MSCI Emerging Markets index (proxied by the iShares MSCI Emerging Markets ETF in the chart below) has yet to break out to new highs from its prior high in 2021. This has been a long time coming for investors in emerging markets and it will be interesting to watch to see if the index can break out and sustain a bullish run through new highs.
If the index can’t break to new highs, investors may consider it a “double top”, which is a bearish technical development. The index is a fair amount of distance from its 200-day moving average (thin red line), which could result in the index running out of steam at the upcoming prior high resistance level. It would not be surprising if the index consolidated around these levels to build potential “energy” to break through the resistance and reach new highs.
Due to the valuation discount in foreign equity markets relative to U.S. large caps, and with my preference for diversification, I continue to prefer to allocate to foreign equities and maintain my moderately bullish stance. My preference is to overweight quality companies and utilize fundamentally-driven index and actively-managed strategies to gain exposure to foreign equities.
From a tactical positioning perspective, I maintain leveraged equity positions to diversified emerging markets and a dedicated leveraged position to Chinese equities. I may consider reducing these leveraged positions if these areas reach my price targets, continue to outperform other areas of the global markets and/or valuations become less favorable.
If foreign equities continue to outperform U.S. equities and the valuation discount tightens, and the U.S. dollar takes another leg lower, I would consider reducing my view on foreign equities to slightly bullish at that time.
HIGH INCOME
I remain moderately bullish on high income assets and strategies. I continue to prefer to gain exposure through actively-managed strategies across global equity dividends, option income, credit-sensitive corporate, emerging market and securitized bonds, tactical multi-asset income and closed-end funds.
As global equity valuations continue to expand higher, I believe the risk of a potential pullback due to extended valuations increases. For this reason, I continue to prefer to be allocated to higher income-generating assets and strategies that can generate income returns in a flat equity market or may provide downside protection in an equity market decline.
Credit-sensitive below investment grade and other non-core bond sectors currently trade at tight credit spreads to Treasuries, which is less attractive at these levels relative to Treasuries. On the other hand, the absolute yields of above 6% in some cases are attractive at these levels, in my opinion.
If I assume equity valuations are somewhat elevated, particularly in U.S. large caps, and the intermediate-term return potential from equities might be 6-8%, receiving 6%+ yields from credit-sensitive bonds that could act as a diversifier to equities makes these bonds attractive, in my opinion.
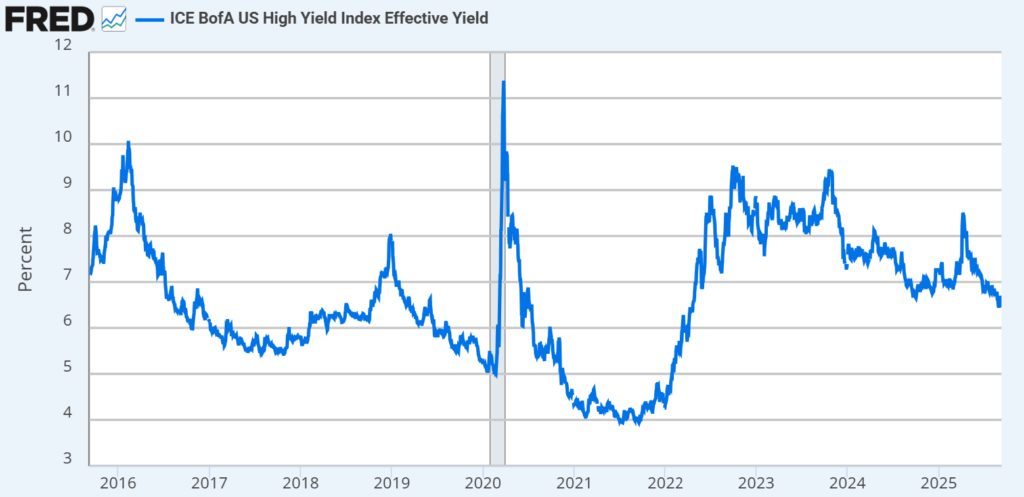
Below Investment Grade High Yield Corporate Bond Yields
As shown in the chart below, the total yield provided by below investment grade (high yield) bonds has been declining since their highs in 2023 and 2024. At least per the high yield index, the yield remains above 6%. If yields decline below 6%, I would become increasingly cautious on below investment grade high yield bonds in general. With yields where they are currently, I still like high yield bonds as an income-generating asset to complement my equity exposure.
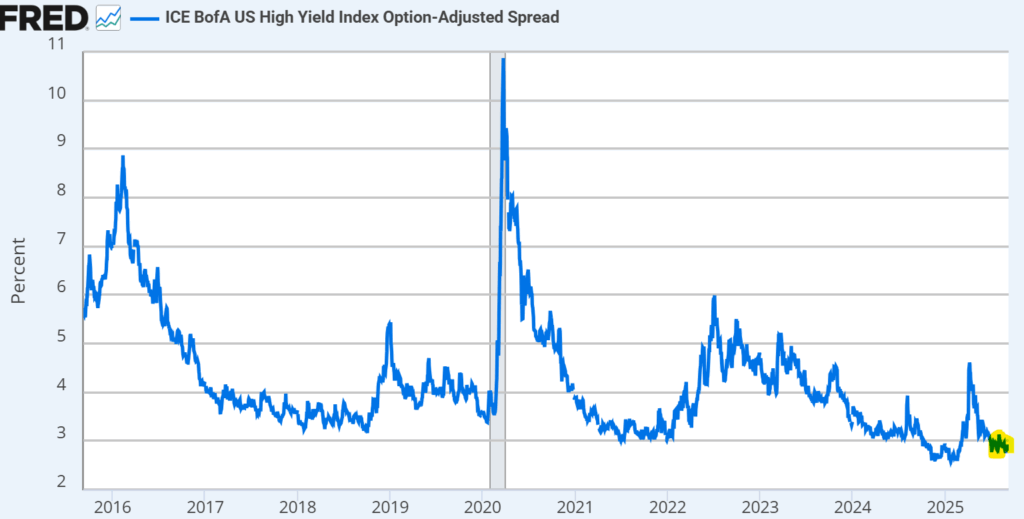
Below Investment Grade High Yield Corporate Bond Credit Spreads
As you can see in the chart below, high yield bond spreads are tight relative to Treasuries, and tighter than the average credit spread levels over the last 10 years. Although absolute yields are still somewhat attractive relative to equities, relative to safe, investment grade bonds like Treasuries, the tight high yield credit spreads are less attractive.
Equity option income strategies are also attractive, in my opinion. These strategies may provide exposure to equities with higher income distribution yields of 6-8% from the option income overlay. Please keep in mind that the income yield generated will depend on the specific option income strategy utilized. In a flat equity market or persistent down market, these strategies could be beneficial due to the general lower volatility and higher income potential of the strategies. With my concern on U.S. equity large cap valuations, having an allocation to equity option income strategies makes sense to me.
Closed-end funds are where I am becoming increasingly cautious. I am only slightly bullish on closed-end funds at current levels, not moderately bullish like I am on the broader High Income category. Based on closed-end fund related strategies that I cover from a research standpoint and invest in, the weighted average price discount of closed-end funds to their net asset values (NAVs) is getting pretty tight. Closed-end funds can utilize leverage to enhance returns/income which in turn can add to the volatility of these strategies.
With credit spreads and closed-end fund discounts to NAV tight relative to history, I have changed my view to slightly bullish on closed-end funds in general. I have not reduced my exposure to closed end funds at this time, but if credit spreads and closed-end fund discounts to NAV continue to tighten, I may consider doing so.
I continue to like exposure to tactical, multi-asset income strategies with investment managers that have the flexibility to allocate across various income-generating assets. This flexibility provides the investment manager the ability to take advantage of nuanced investment opportunities and strategies that I can’t get direct exposure myself. For this reason, I prefer to allocate to these actively-managed, multi-asset income strategies instead of tactically adjusting smaller exposures myself.
COMMODITIES
I remain slightly bullish on commodities overall and prefer to lean on market technicals for guidance on potential direction in this environment.
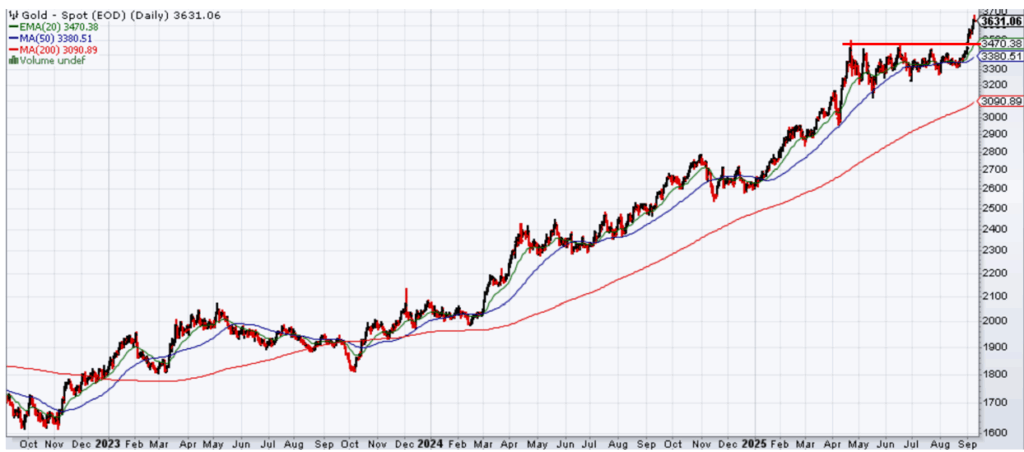
Gold
Gold prices had a period of consolidation from April through the end of August as gold bumped up against technical resistance at its prior April highs. This allowed other technical indicators to catch up, as seen in the price chart of gold below and the rising 200-day moving average (thin red line) below providing a potential floor under gold prices.
As mentioned in prior posts, I don’t have a fundamental view on gold for reasons already stated throughout the site. Instead, I’ll use market technicals to help guide my views on gold. Based on the persistent trend of gold higher, the gold price breaking above its short-term resistance level (thick red line), and gold staying above its 200-day moving average, I remain slightly bullish on gold. If gold falls below its support level or 200-day moving average and/or other reasons cause me concern, I may become slightly bearish at that time.
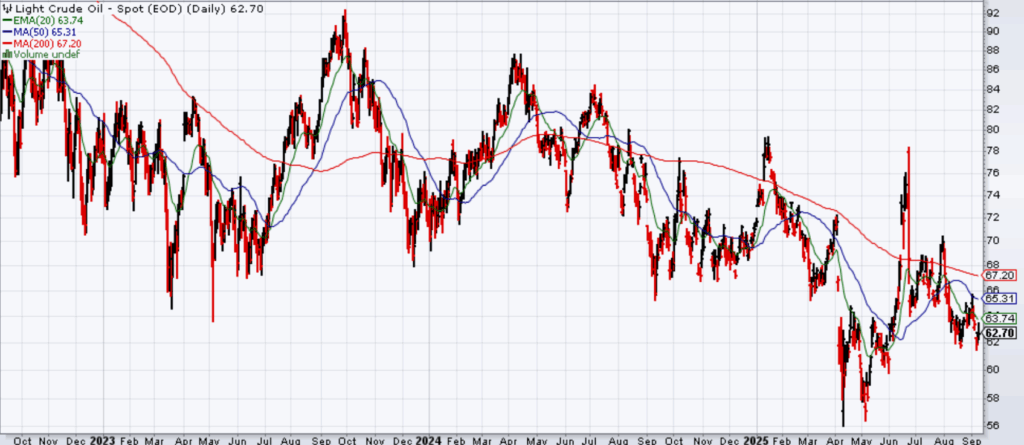
WTI Crude Oil
WTI Crude Oil prices have been volatile in a tight range the last few months, without any persistent trend higher or lower. Oil has tended to trade within a $60-$90 per barrel range and we are currently at the lower end of that range. Like gold prices, I tend to lean heavier on market technicals for oil prices, although insights into oil supply and demand can help.
With WTI Crude Oil at the bottom of the longer-term trading range and a belief that it can trade upwards within that range from here, I’m moderately bullish on oil prices at these levels. Global oil supply is currently high and demand is uncertain, keeping downward pressure on prices. If the global economy picks up steam, and/or if geopolitical tensions escalate in the Middle East / Russia resulting in oil supply disruption, oil prices could push higher from here.
CONSERVATIVE ASSETS
As interest rates have fallen across the yield curve this year and credit spreads have tightened further, I have reduced my bullish view from moderately bullish to slightly bullish.
Bonds have performed well this year, with attractive income generation and price appreciation from the yield curve shifting lower and credit spreads tightening. Investors that were willing to take on credit risk and some interest rate exposure have generally outperformed.
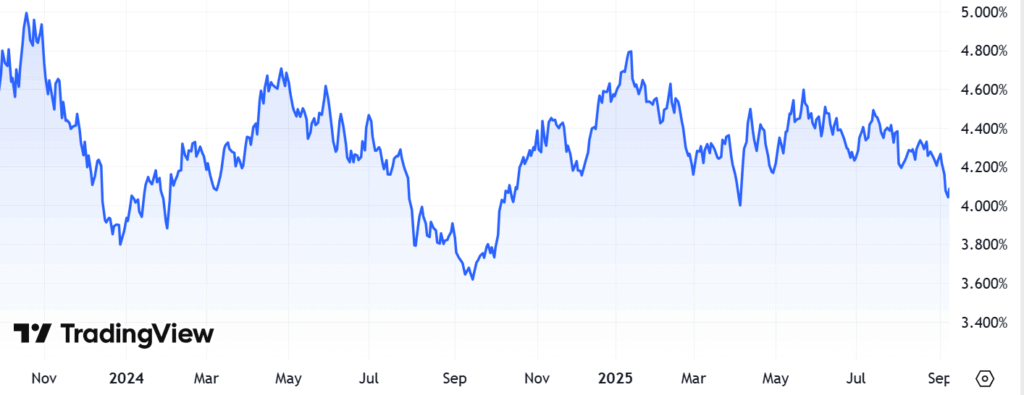
If we isolate the 10-Year Treasury bond yield as shown below, you can see that it has traded in a volatile range over the last two years. We are now in the middle part of the range of roughly 4.5% on the high side and 3.5% on the low side.
10-Year Treasury Bond Yield
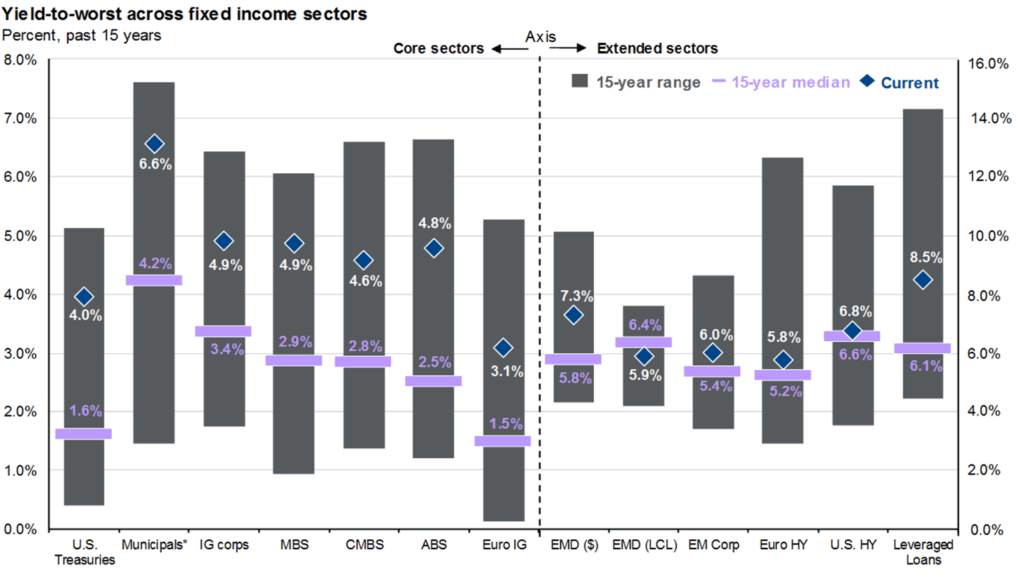
As you can see below, bonds across sectors are paying roughly 5% or more, with higher yields available the farther you go out on the risk spectrum (high yield, loans, emerging markets debt).
For my conservative assets and bond allocation, I continue to prefer allocating to actively-managed bond strategies where investment managers have the ability to be flexible across sectors, credit quality and duration positioning with added value potential through security selection.
U.S. GOVERNMENT BONDS
I remain slightly bullish on U.S. government bonds at these levels.
Bond yields across the yield curve have come in from their highs of the year, which if inflation remains in the high 2% to lower 3% range, the Fed may keep interest rates higher for longer. This could result in the Treasury yield curve remaining in the range it’s been for over a year, with the 10-year Treasury yield trading between 3.5% and 4.5%.
If we see better signs of declining inflation rates, the markets could start pricing in bigger Fed rate cuts, the Treasury yield curve could shift lower and bonds could rally even further.
With the 10-year Treasury yield at roughly 4% as of September 10th, I remain slightly bullish on U.S. Treasuries at this time. If the economy really starts to weaken and markets price in further rate cuts, the yield curve could shift down, interest rates decline and interest rate-sensitive bond prices could rally. If the yield curve jumps back up higher to the top of its range, I would consider becoming increasingly bullish on Treasuries and duration at that time.
You can see the volatility in the Treasury yield curve in the chart below…
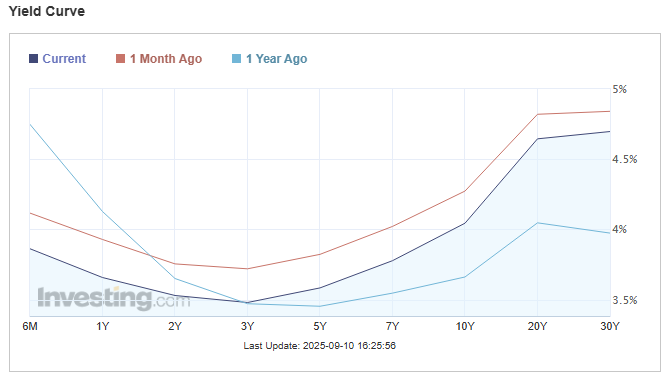
U.S. debt levels remain high, which could keep the longer end of the yield curve somewhat anchored, maybe 4.5% and above. With tariff policy uncertainty back to the forefront and any additional tariff revenue at risk, bond investors may require higher long-term rates for U.S. Treasuries. Due to this potential volatility, I would prefer to remain underweight longer-term bonds at this time.
Due to the breadth of bond options available outside of Treasuries, I continue to favor diversified exposure across investment grade bond sectors rather than a material allocation to Treasuries at this time.
U.S. INVESTMENT GRADE CREDIT
Although investment grade credit spreads have continued to tighten, I remain slightly bullish on investment grade credit at this time.
Following the credit spread widening in March/April, spreads have tightened again leaving investment grade credit less attractive at these levels than they had been. On an absolute yield basis, investment grade corporate credit can provide yields of over 4.5%, which is still attractive, particularly relative to the last 10 years when interest rates were lower overall.
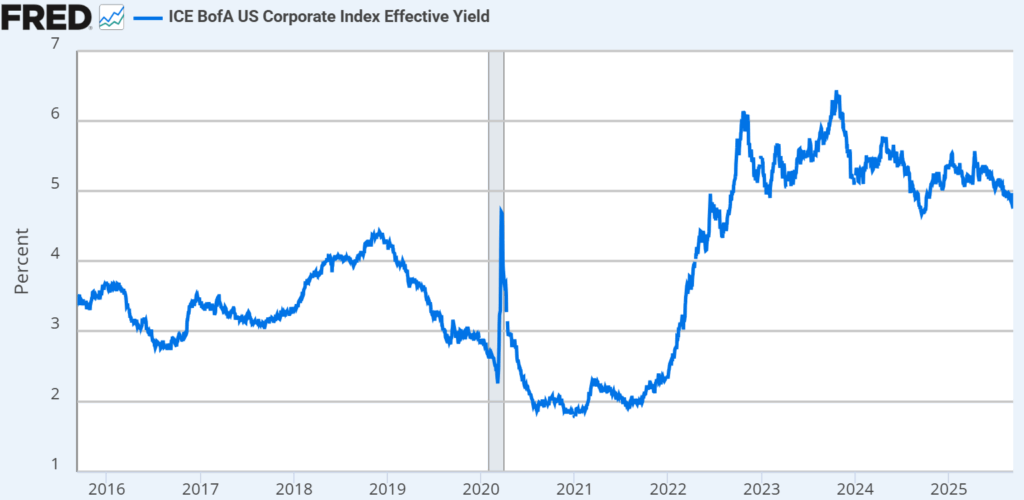
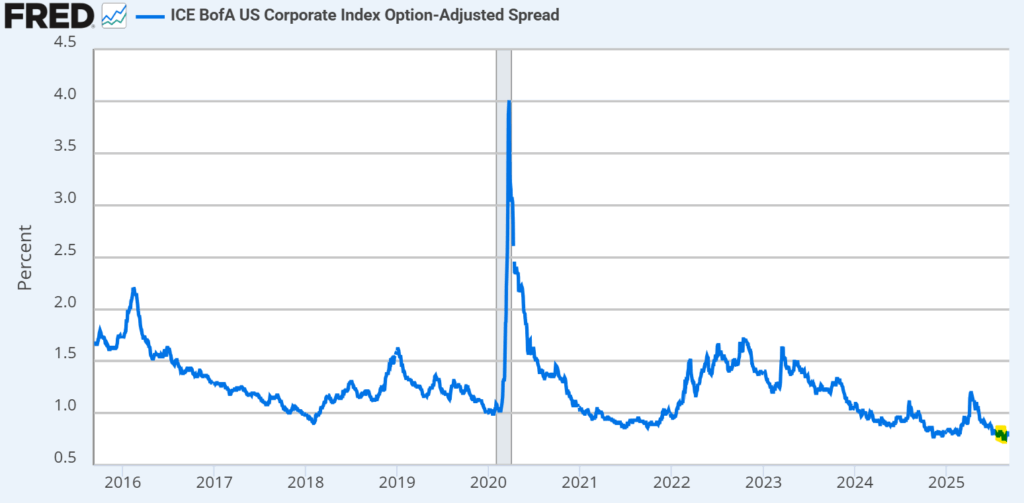
Source: Ice Data Indices, LLC, ICE BofA US Corporate Index Effective Yield [BAMLC0A0CMEY], retrieved from FRED, Federal Reserve Bank of St. Louis; https://fred.stlouisfed.org/series/BAMLC0A0CMEY, September 9, 2025.
As you can see in the chart below, credit spreads are at the lower level of the 10-year range. As you can also see, there have been multiple periods where spreads widened to higher levels than we are at today. Even though credit fundamentals continue to appear pretty solid, with tight credit spreads, I prefer be a bit cautious at these levels and maintain a slightly bullish view on investment grade credit.
We’re months from the spike in volatility in March and April, and markets are a bit subdued. The sharpest volatility spikes often come from events that investors aren’t anticipating. High quality bonds can serve as a ballast to portfolios and a potential diversifier to equities.
At current spread valuations, I prefer my bond allocation to remain higher quality, with duration in line with core bond indices. If we get into a period of weaker economic growth and investors anticipate the Federal Reserve to cut rates, interest rates along the yield curve could decline, pushing bond prices higher. In my opinion, having high quality bonds with moderate duration exposure at these levels could be beneficial to try to protect in a weaker, risk off environment.
OTHER
I use this section to talk about other potential strategies, generally whether or not hedges are needed on asset classes.
I remain slightly bullish on other, non-traditional investment strategies at this time.
With U.S. and foreign equity valuations at higher levels than where they were in March and April and over longer time periods, I’m much more neutral on risk assets positioning than I was just 3 months ago.
With multi-asset income strategies and credit-sensitive bonds continuing to offer attractive income yields, my preference is to allocate to these strategies rather than to complex hedging strategies at this time. I’m also staying away from tactical sector rotation strategies that claim added value from macro-driven sector positioning due to the U.S. government policy uncertainty that seems to persist.
For more cautious investors that prefer non-traditional hedging strategies to traditional assets, hedged equity strategies make sense to me at these levels. On the bond side, with credit spreads pretty tight, having hedged credit strategies that can hedge credit risk and focus on idiosyncratic, less credit market beta strategies can also be beneficial in this environment.

Eric Kulwicki, CFA®, CFP®, brings 20+ years of experience, currently serving as an independent investment consultant, portfolio manager, and wealth advisor for institutional and retail clients. On KulwickiInsights.com, Eric shares his timely perspectives on financial markets, investment strategies, and other financial topics. He also offers online investment education courses for beginner and intermediate investors, and coaching sessions for DIY investors seeking professional guidance.