
SUMMARY
- U.S. Equities: I remain slightly bullish on U.S. equities but prefer a neutral stance relative to long-term risk targets. While fiscal stimulus and Fed cuts support the market, large-cap valuations are at the higher end of historical ranges. This suggests future returns may be muted for broad large cap, market cap-weighted indices. I continue to favor diversification into mid cap and small cap stocks and across investment styles (growth, core, value), with a focus on higher quality, growing companies.
- International Equities: I have reduced my outlook to slightly bullish from moderately bullish following strong rallies in foreign equity markets. The valuation gap between U.S. and international stocks has narrowed, reducing the opportunity that existed earlier this year. While earnings growth supports continued exposure, the “easy money” may have already been made. I have taken profits in leveraged emerging market positions and prefer a more risk-neutral approach rather than holding material overweights. I continue to prefer diversification across market cap, investment styles and geographies.
- High Income-Generating Assets: I maintain a moderately bullish view on high-income assets, with income generation that can exceed 6% through diversified strategies. In an environment where equity valuations may be a bit stretched, income generation could act as a stabilizer. Although credit spreads are historically tight, I accept this risk because of extended valuations in U.S. large-cap equities. I’m still slightly bullish on closed-end funds and prefer to wait for wider discounts before increasing exposure.
- Commodities (Gold & Oil): Gold has rallied significantly this year and remains technically strong, but it may be a bit overbought over the short-term. WTI Crude Oil continues to grind lower due to global oversupply, though prices may have a fundamental floor near $50 to $55 per barrel. I remain moderately bullish on oil over the intermediate-term, anticipating that production cuts could prevent sustainable drops below that profitability threshold.
- Conservative Assets (Bonds): I am slightly bullish on conservative assets, favoring active management over passive indexing to navigate tight credit spreads. While credit-sensitive bond valuations are a bit rich, U.S. Treasuries could offer some protection if volatility rises. I generally avoid being significantly hedged on credit, as corporate balance sheets remain healthy. For high-income earners, municipal bonds might currently offer compelling value relative to Treasuries.
- Other (Hedges): I remain slightly bullish on non-traditional and hedging strategies with no immediate need for aggressive hedges. The global economy and corporate earnings are forecasted to remain solid next year, which could support asset prices. While volatility might pick up later in the year due to mid-term elections, current valuations outside of artificial intelligence and speculative areas of the market appear slightly elevated but manageable. For now, I prefer to remain patient with a neutral risk profile and without material hedges on risk assets.
Since my last Outlook & Positioning piece on September 12th, global equity and bond markets have continued to grind higher overall. This year has been defined by resilience, where a combination of international market strength, the transformative potential of artificial intelligence (AI), a persistent move to gold, and investors chasing speculation.
Although financial markets have been strong this year, there have been bouts of volatility. Following the spike in volatility in March and April, there was a period of subdued volatility throughout summer. Low volatility often precedes periods of higher volatility. In October and November, volatility picked up again. You can see the spike in volatility in the following chart of the S&P 500 Volatility Index (VIX).
S&P 500 Volatility Index (VIX)
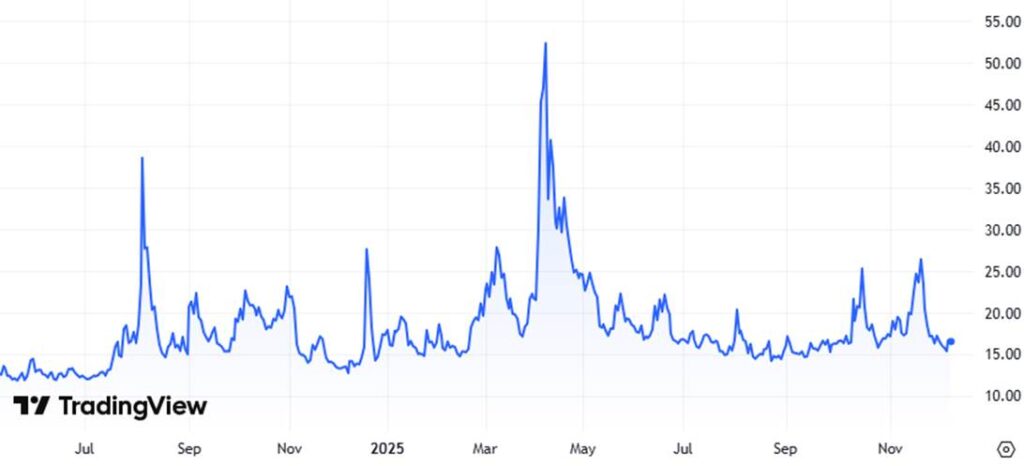
Markets were forced to endure a historic 43-day U.S. government shutdown that finally ended in mid-November. While this political gridlock created headline anxiety, it technically served a healthy purpose by allowing some of the excess froth to exit the market.
While the broader indices held up, we witnessed a necessary correction in speculative excess and momentum-driven investments starting in early October and extending through November. Some of the most speculative areas, particularly individual stocks with weak profitability, were hit hard in October and November. Some stocks declined over 50% from their peaks. This sharp drawdown serves as a critical reminder of how quickly momentum in speculative, non-profitable company stocks can reverse to the downside. Since the resolution of the shutdown, we have seen a rebound, and seasonal tailwinds may continue to support the market through the end of the year.
I consider myself a patient investor and let the markets come to me. I try to take advantage of spikes in volatility and add to long-term risk positions for longer-term appreciation potential. At this time, I’m remaining patient and waiting for periods of heightened volatility to try to take advantage of again.
Fiscal Stimulus and The Fed
Investors appear to remain bullish based on the dual backdrop of fiscal stimulus and monetary easing. The One Big Beautiful Bill Act (OBBBA), signed in July, continues to flow through the economy. This stimulus is a double-edged sword: it boosts near-term growth but raises legitimate long-term deficit concerns. This structural anxiety likely explains why gold is rallying concurrently with equities. It’s a rare dynamic that may suggest investors are buying stocks for growth while buying gold to hedge against fiscal instability.
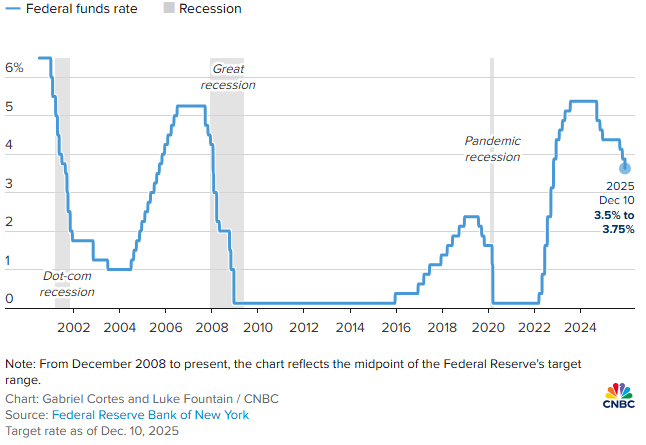
Adding to the bullish case for risk assets, the Federal Reserve resumed its interest rate cuts in September, October and just now again in December. The fed funds rate target range is now 3.5%-3.75%. The Federal Reserve is signaling a potential pause from here, with potentially limited rate cuts in 2026. With the potential for further rate cuts in the future, and probably a limited possibility for rate hikes, unless inflation reaccelerates, the monetary policy environment remains supportive of asset prices.
Fed Funds Rate
Tariffs and The Supreme Court
Despite the supportive macro environment, tariffs remain a lingering uncertainty as increased costs continue to flow through the economy. The critical question now is whether these tariffs will be sustained legally. In November, the Supreme Court heard arguments on whether the President Trump can rely on the International Emergency Economic Powers Act (IEEPA) to impose tariffs without Congress.
A decision is expected by June of next year, and the stakes are high. A ruling against the Trump administration could unwind billions in tariffs, effectively delivering a large tax cut to U.S. importers, which would be a significant positive for retail companies. Conversely, if the Court upholds the authority, it would reinforce broad executive control over trade policy, cementing tariffs as a long-term economic reality.
Looking Forward to 2026
Looking forward, 2026 is forecasted to be a solid year for U.S. earnings growth across market capitalization. This suggests we could see a “broadening out” of market performance, particularly into higher-quality companies rather than just speculative stocks. This rotation is healthy for the markets and investors alike.
As we move through the first part of next year, mid-term elections will become a primary focus, and volatility could pick up, potentially starting in the summer. At that time, investors should also start looking harder at the potential earnings and economic backdrop for 2027 and position accordingly.
The combination of Fed easing, resilient corporate earnings, and the cleared political hurdles following the shutdown resolution supports a bullish backdrop. However, leverage and valuations remain high, and next year’s mid-term elections are a factor investors will need to address.
In this environment, it does not make sense to me to be overly aggressive in my allocations. I prefer to stay neutral relative to my long-term risk profile.
My Positioning and Tactical Adjustments
I remain constructive on the broader market given the resilient corporate earnings backdrop and a generally supportive economic environment. Despite this bullish fundamental outlook, I prefer to remain risk aware. I am currently positioned neutrally relative to my long-term risk targets rather than chasing performance with material overweights in any specific area. My preference right now is to remain highly diversified.
I am currently only slightly bullish across various asset classes, preferring to remain patient and let volatility bring the market down to me, whenever that may occur. I do maintain a moderately bullish stance on high income-generating assets and strategies. In an environment where yields remain attractive, this provides a cushion against potential equity volatility.
I’m avoiding chasing assets with elevated valuations. We are seeing stretched multiples in several areas, and chasing returns doesn’t make sense to me. I’m currently fairly risk neutral, with plenty of “dryer powder” to put to work if the markets experience a deeper drawdown. If we see a deeper risk sell-off across asset classes, I will be prepared to increase risk exposure to build my longer-term positioning at more favorable valuations.
De-Leveraging Positions Following the Rally
As risk assets have continued to grind higher without significant downside volatility since March and April of this year, I have utilized this strength to prudently reduce overweight leveraged positions across my U.S. Core X and Global Unconstrained strategies. These were structural risk reductions when my price targets were hit, not based on a fundamental view on any position.
In September, as small-cap equities hit new highs, I reduced my leveraged exposure to the space. Although my large and small cap positions hit new highs and I have been reducing leverage exposure, my mid cap exposure did not hit new highs. For that reason, I have maintained a slight overweight in my leveraged mid cap exposure.
The biotechnology sector has rallied significantly since the April lows. As prices pushed aggressively to the upside, I reduced my leveraged exposure to biotech stocks in October and again in November. I am now at my smallest allocation to leveraged biotech stocks in over four years. I have actively traded this sector since establishing the initial position, trading volatile periods in the space. My recent reduction in leveraged biotech exposure reflects my price targets being hit after a nice rally higher.
I continue to maintain small leveraged exposures to Chinese equities and diversified emerging markets as we head into year-end. This is a tactical play on valuations which remain depressed compared to U.S. markets. However, this is a reduced position compared to the elevated allocations I held last year, reflecting strong rallies in these positions and an awareness of the ongoing geopolitical uncertainties.
If markets continue to grind higher, I may further reduce leveraged exposure across my exposure to U.S. mid- and small caps, Chinese equities, diversified emerging markets, and biotech stocks. If these areas do not hit my upside targets, I will remain patient and wait for the market to come to me instead.
RISK ASSETS

I remain slightly bullish on risk assets overall at this time.
My allocation preferences have been nuanced and pretty consistent. I continue to prefer broad diversification across investment styles (growth, core, value), market capitalization, and geography. My primary focus remains on high-quality companies with sustainable growth and a dedicated exposure to higher income-generating assets.
Risk assets have performed exceptionally well year-to-date. We have seen robust returns from international markets, artificial intelligence-related companies, gold and higher beta, speculative stocks.
Sector Rotation and Quality Factors
Beneath the surface of new all-time highs in equities, we may be starting to see a little rotation. We may be witnessing a shift from pure AI-driven momentum and speculation towards broader strength. This rotation may be partially driven by emerging clarity on U.S. corporate tax policy, the passing of time from the initial price shock of tariffs, and expanding economic stimulus in the rest of the world.
A deeper analysis of market drivers reveals that many “boring” higher-quality companies across traditional sectors have simply treaded water this year. Quality stocks performed fairly well in 2023 and early 2024, which actually caused some caution from me at the time due to elevated valuations in quality companies. While the underlying quality of these quality companies remain intact, their performance has lagged behind more speculative areas this year. This underperformance may have created an opportunity. Valuations in these higher-quality laggards may now be more attractive, particularly when compared to the momentum sectors that have outperformed year-to-date.
Less Bullish on Foreign Equities
I have previously held a moderately bullish view on international equities, primarily due to their significant valuation discount relative to U.S. markets and decent growth prospects. However, following the strong rally in foreign developed and emerging market stocks this year, I am adjusting my outlook. I have reduced my view from moderately bullish to slightly bullish on foreign equities.
While both U.S. and non-U.S. stocks have performed well, the valuation discount between them has tightened. The arbitrage opportunity is less compelling now than it was earlier in the year. From a global equity perspective, I prefer to maintain a neutral risk stance with a slight bullish bias rather than holding a material overweight in any single geographic region.
Valuation and Earnings Growth
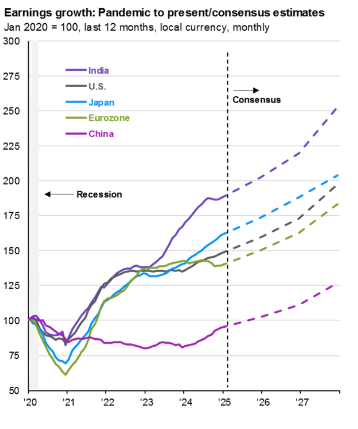
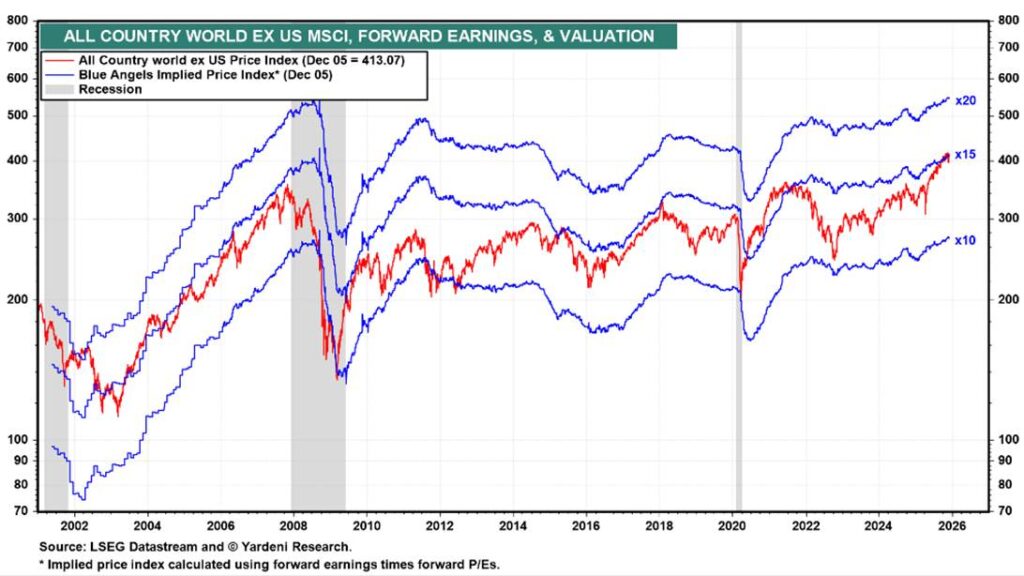
As illustrated in the chart below, equity valuations across the U.S. and international markets have expanded since the beginning of the year. This indicates that price appreciation has outpaced actual earnings growth, a phenomenon known as “multiple expansion.”
Looking forward, I can’t just rely on multiple expansion to drive returns to the same degree, particularly in international markets relative to the U.S. With the valuation gap closing, the easy money in international equities might have already been made.
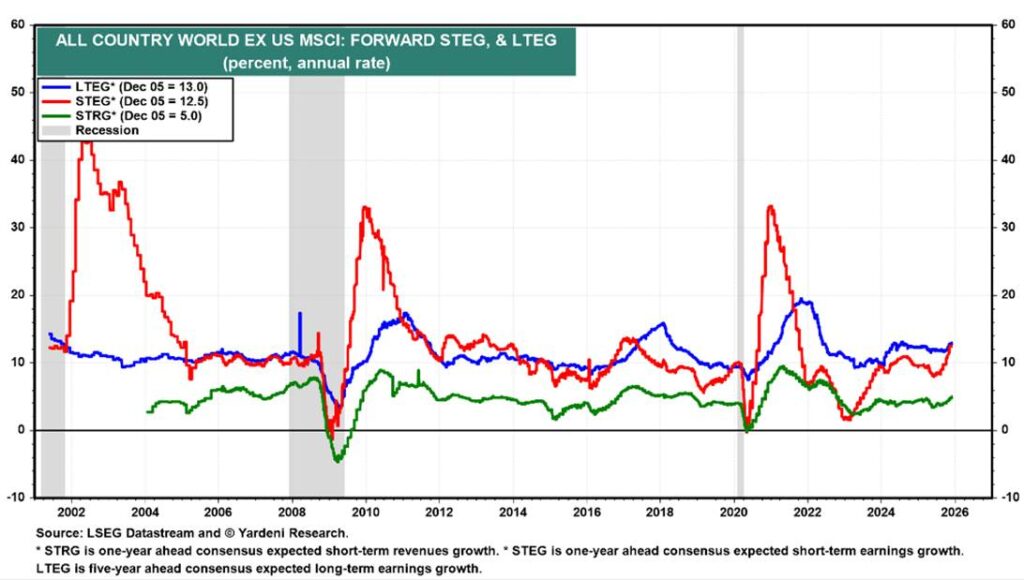
The positive aspect of maintaining global equity exposure is the earnings outlook. Earnings growth is anticipated to continue next year and into 2027 as shown in the following graph. This fundamental backdrop provides a rationale for investors to remain allocated to global equities and potentially use market dips as buying opportunities.
Prefer Exposure to High Income-Generating Assets
I also prefer to maintain a dedicated allocation to higher income-generating assets, remaining moderately bullish to the space at this time. This focus on income generation could become increasingly important in an environment where global equities have rallied significantly and valuations are elevated. Income generation can act as a stabilizing force and a consistent return driver when capital appreciation becomes harder to capture.
U.S. EQUITIES
Finding Nuance in High Quality U.S. Companies
I remain slightly bullish on U.S. equities, though with continued nuance and selectivity.
This past year, we witnessed strong performance across high-quality, profitable companies tied to artificial intelligence, such as Alphabet (Google) and NVIDIA. This rally appears driven by continued aggressive infrastructure build-out, which is a constructive fundamental tailwind.
However, we also observed a significant divergence in market breadth characterized by the outperformance of lower-quality companies. There were instances, particularly within the mid- and smaller market cap companies, where firms with negative Return on Equity (ROE) and negative Return on Assets (ROA) rallied hundreds of percent. From a fundamental perspective, price appreciation that is disconnected from profitability is rarely sustainable.
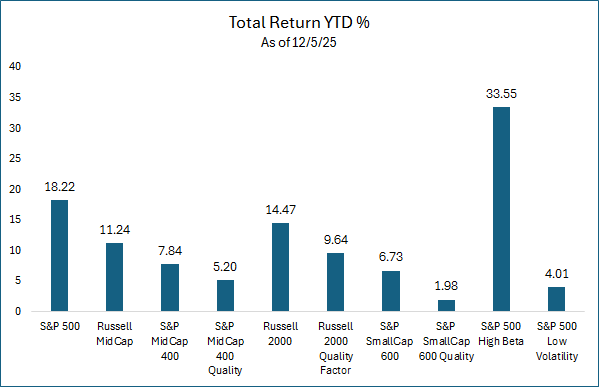
The distinction between quality and speculation becomes clear when analyzing the construction of major indices. The S&P indices utilize a profitability filter for inclusion, effectively acting as a quality screen. In contrast, the Russell indices do not mandate profitability, resulting in a heavier weighting of speculative or distressed companies.
As the following chart illustrates, when you move from the broad Russell indices to the S&P indices, and finally to the specific S&P Quality indices for mid- and small-caps, the material underperformance of higher-quality companies year-to-date becomes evident.
Also, within the S&P 500, “high beta” stocks, those most sensitive to market movements, significantly outperformed “low volatility” stocks this year. This indicates a risk-on environment where speculative growth stocks generally outpaced stable, defensive equities.
While lower-quality, higher-volatility stocks have led recently, I think this could be a dislocation rather than a durable trend. As an investor who prefers capital allocation to the stocks of companies with strong balance sheets, profitability and sustainable growth, the temporary lag in these higher quality companies’ performance doesn’t concern me. The critical question is whether the rally in speculative assets is sustainable. I don’t think it is.
Valuation Concerns in Large Caps
Many investors default to passive allocation in the S&P 500, which is dominated by mega-cap, technology-related companies. My primary concern with passive investing in U.S. large cap, market-cap weighted indices, is the expanded valuation of the passive indices as a whole. As shown in the graph below, there is a widening gap between price (light blue line) and earnings per share (EPS) growth (dark blue line). When price momentum outpaces fundamental earnings growth to this degree, it signals multiple expansion rather than organic growth, which increases the risk profile of the index.
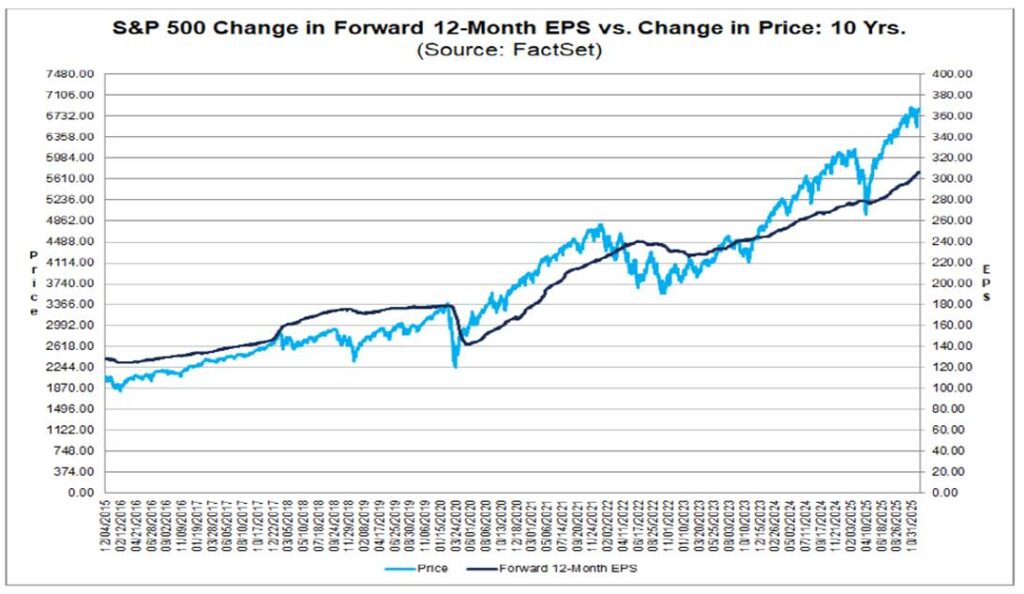
For this reason, I prefer to maintain diversification beyond U.S. large caps. I would rather expand exposures to higher quality mid- and small-cap companies’ stocks and stay diversified across investment styles including growth, core, and value.
Historical Perspective on Multiples
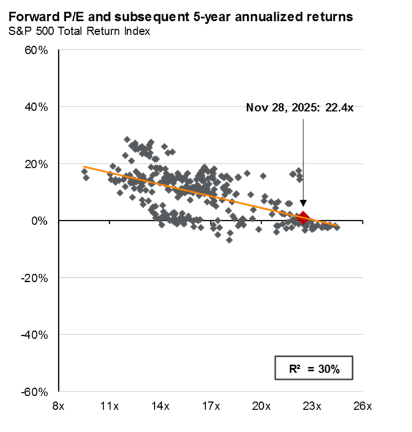
History suggests caution when valuations reach extremes. When the forward price-to-earnings (P/E) ratio climbs to current levels of roughly 22.4x forward earnings, future returns have historically been muted.
The chart below illustrates that at these valuation heights, subsequent 5-year annualized returns of the S&P 500 Index have often been limited. While market dynamics can shift and “this time” could potentially be different, it is difficult to ignore historical precedents. This data at least suggests a cautious stance on broad, passive, U.S. large-cap exposure at this time.
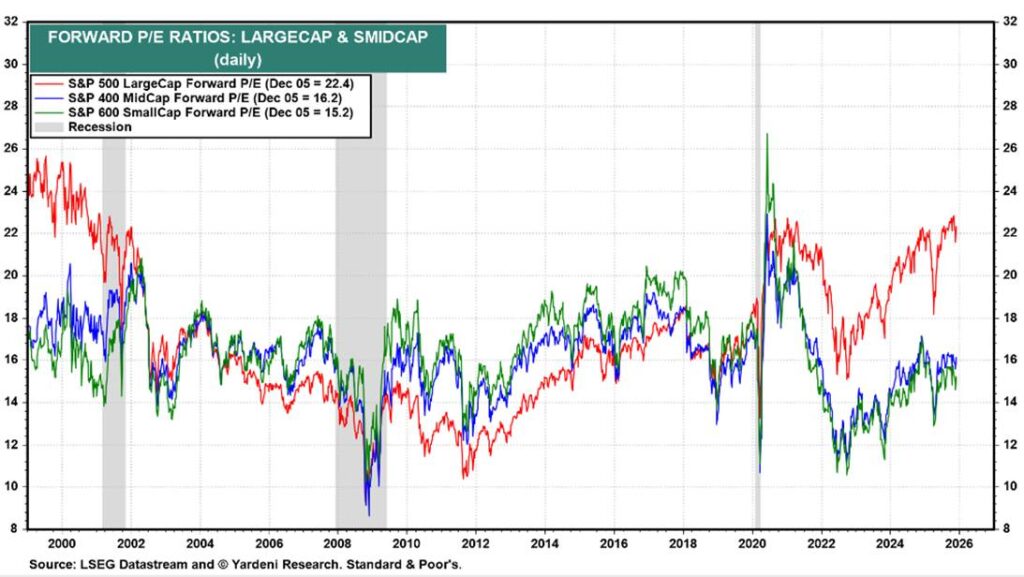
Potential Opportunity in Mid- and Small Caps
There is a potential relative value argument for moving down the market cap spectrum. When comparing U.S. large, mid-, and small cap stocks, there appears to be a valuation discount in mid- and small caps. The graph below highlights that mid- and small-caps are trading at a discount not only to large caps but also relative to their own historical averages. In addition, large caps are trading above their historical valuation range, adding an element of risk to current valuations.
U.S. Large Caps
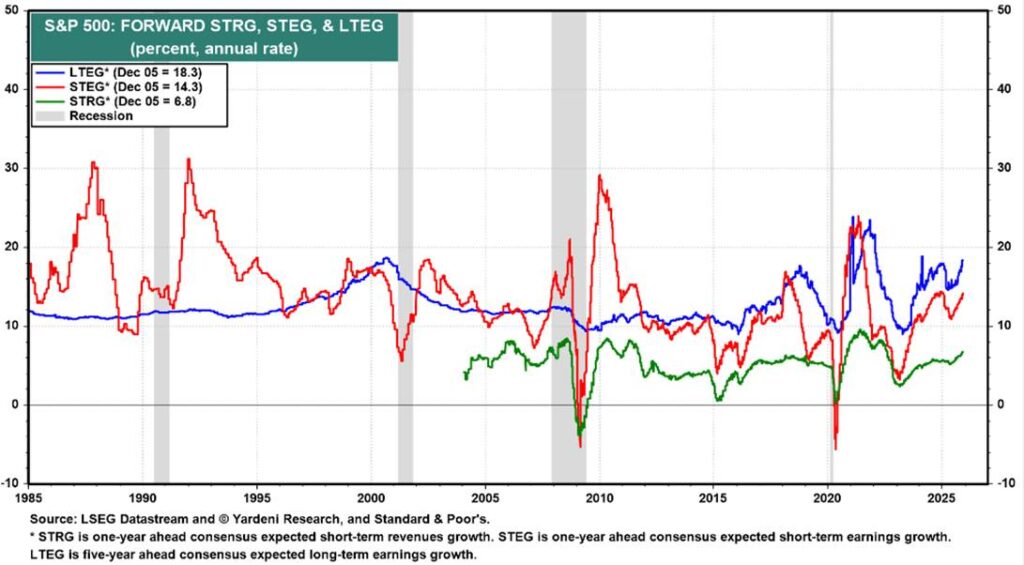
Despite valuation concerns, a strong positive factor for continued exposure to U.S. large caps is the earnings outlook. Earnings growth for the S&P 500 is forecasted to remain in the mid-to-high double digits over both the short term (1 year) and long term (5 years). If this level of earnings growth persists, it could establish a fundamental floor under equity prices, preventing material sustained drawdowns. If this growth narrative holds, market declines could continue to be bought by longer-term investors seeking entry points.
U.S. Mid Caps
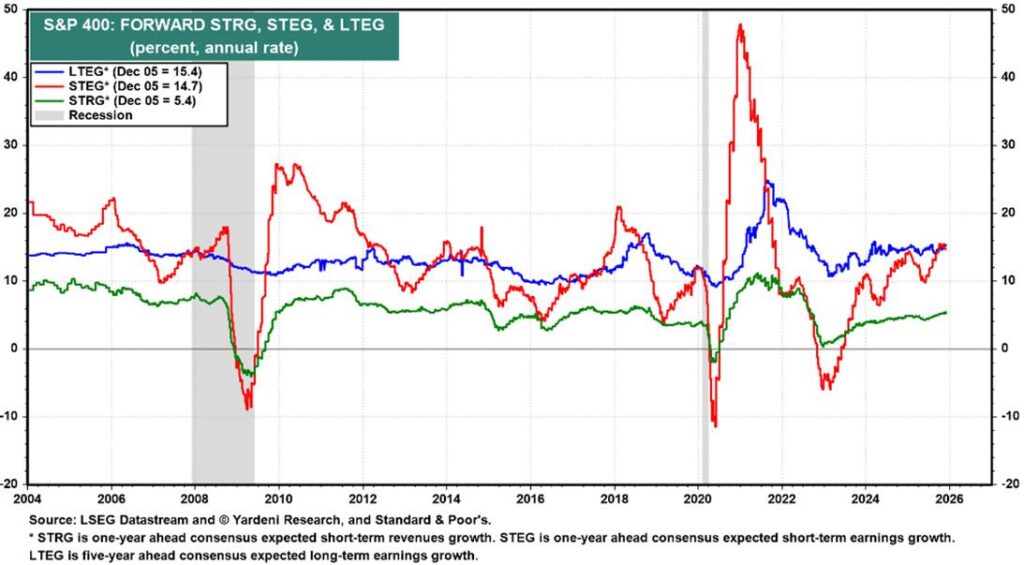
Looking at the fundamentals of mid caps, based on the S&P MidCap 400 Index, the outlook appears solid. Short- and long-term earnings growth is anticipated to fall in the 14% to 15% range. With mid caps trading at a valuation discount to large caps while offering solid growth prospects, maintaining diversified exposure to this mid caps remains appears prudent.
U.S. Small Caps
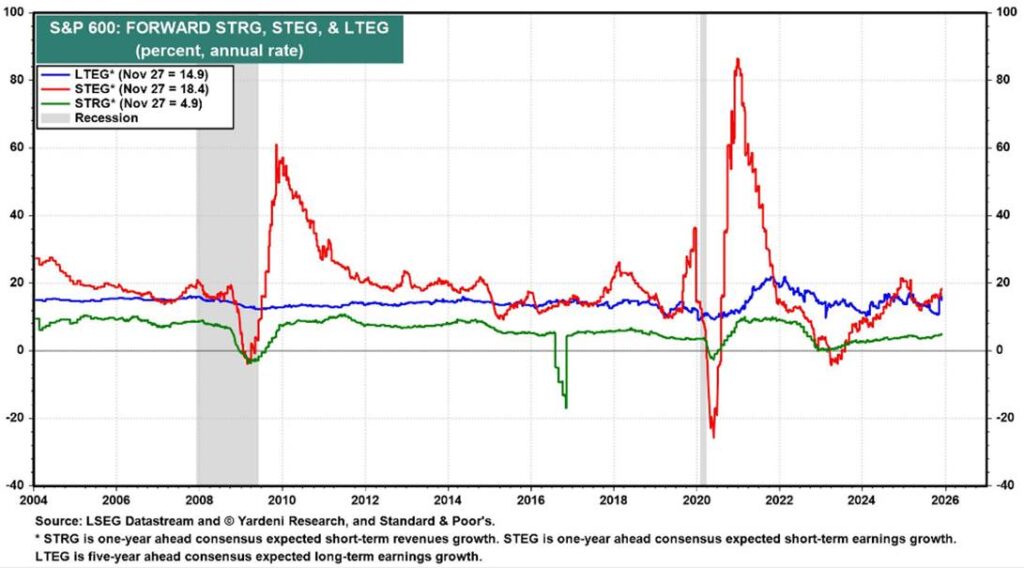
Similarly, small caps, as defined by the S&P 600 Index, are anticipated to generate solid earnings growth of over 14% to 18% over the next one to five years. Given the valuation discount relative to large caps and the quality filter inherent in the S&P 600 Index (versus the Russell 2000 Index), I continue to prefer allocating to these higher-quality small cap equities for diversification purposes.
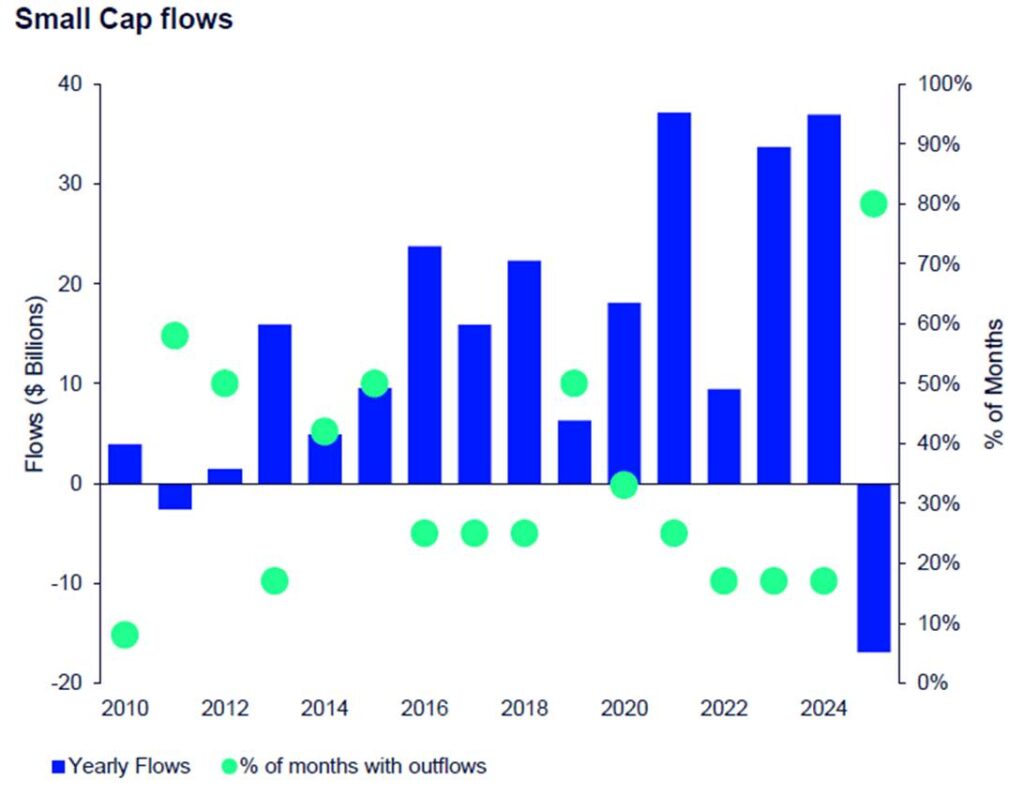
A significant headwind for small caps this year has been liquidity and sentiment, evidenced by material outflows from small cap-focused investments. Part of the reason may be due to smaller companies’ tougher challenges with tariffs and higher interest rates.
As seen in the following chart, small caps have experienced some of the most persistent outflows of the year. This presents a potential contrarian opportunity. If this trend reverses and we see positive inflows next year, combined with stronger earnings growth and attractive valuations, small caps could be positioned for a solid year in 2026.
Market Technicals
From a technical perspective, U.S. equities remain in a bullish trend, though the charts suggest that some consolidation is necessary. Large cap stocks currently look stronger than their mid- and small cap counterparts. Small caps, as defined by the Russell 2000 Index, have lacked the escape velocity to break decisively above recent highs, while higher quality mid caps have yet to reach new highs since 2024.
Given stretched valuations, market technicals will be a critical factor to watch in the coming year. A period of consolidation could be healthy for the U.S. equity market from both a technical and valuation perspective. If quality companies can continue to generate growth over the next six months, valuations may normalize. This would allow technicals to reset and potentially support the U.S. equity market as it grinds another leg higher.
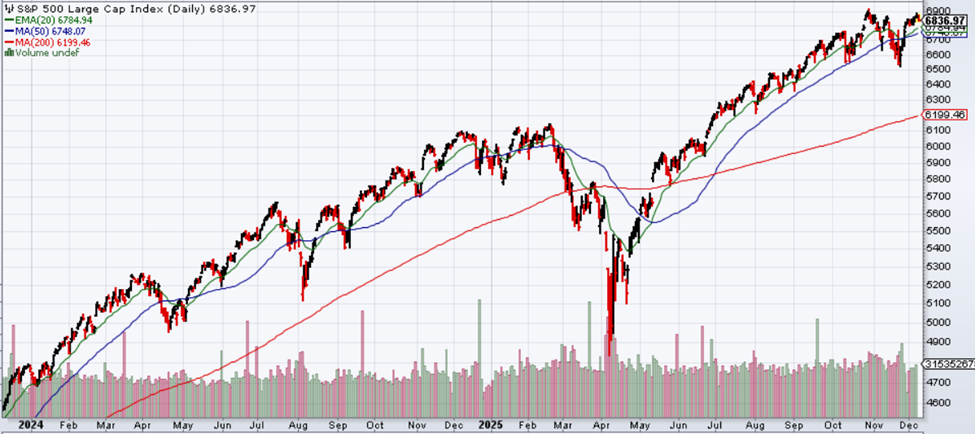
S&P 500 Index
For the S&P 500 Index, the price action has been resilient. The index managed to stay above its 50-day moving average (the blue line in the following graph) immediately following the volatility of President Trump’s “Liberation Day” tariff announcement. However, volatility picked up in November and caused the index to dip below this key short-term trendline. To maintain the momentum of the current rally, the S&P 500 likely needs to sustain a price level above 6900.
Investors should also note the longer-term trend. The 200-day moving average (the red line) continues to grind higher. This rising long-term average acts as a floor of support for investors, confirming the primary trend remains positive. There is a caveat to this strength, however. The current distance between the price of the index and its 200-day moving average is somewhat wide. History suggests that when the price stretches too far from this average, the market is prone to a pullback. We saw this dynamic play out in March and April when the market declined below its 200-day moving average and volatility spiked quickly. It might be best to see some consolidation in the near term to establish a healthier technical foundation for next year.
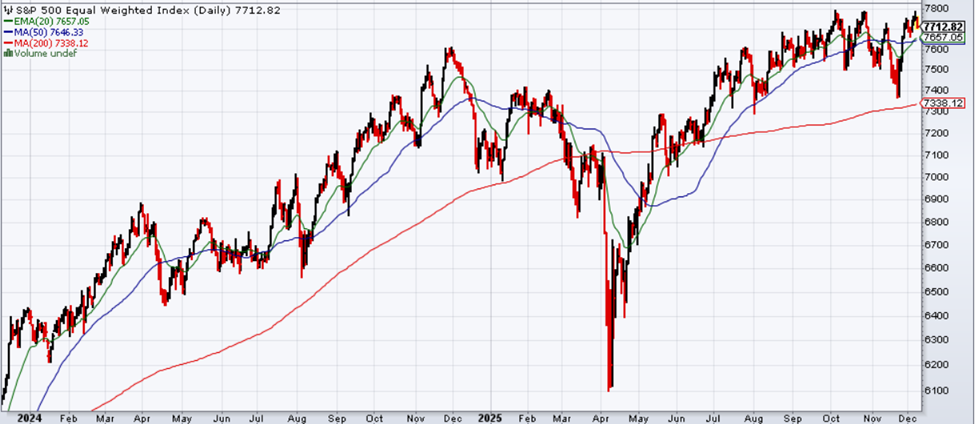
S&P 500 Equal Weighted Index
Looking beyond the largest companies reveals important nuances in market participation. The S&P 500 Equal Weight Index removes the skew caused by the massive market capitalization of the largest tech stocks in the market cap-weighted S&P 500 Index.
This index has yet to sustainably make new highs this year, indicating that the rally has not been as broad as some investors might assume. While the 200-day moving average is much closer to the current price compared to the market cap-weighted index, the Equal Weight Index did successfully test this support level in November and bounced higher.
NASDAQ 100 Index
The technology-heavy NASDAQ 100 Index finds itself in a similar position. Like the S&P 500 Index, it faces a critical technical test and needs to hold sustainably above the 26,000 level for the rally to persist. The bullish backdrop remains intact here as well, evidenced by the rising 200-day moving average.

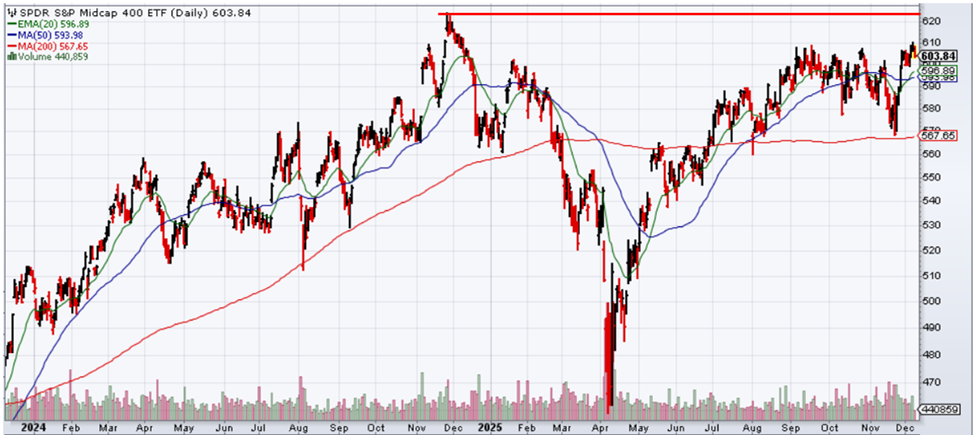
S&P 400 Mid Cap Index
Mid cap stocks have shown less strength. The S&P 400 Mid Cap Index (proxied by the SPDR S&P Midcap 400 ETF) generally lagged throughout the year and still has ground to cover to reclaim the highs established in late 2024. The 200-day moving average for mid caps is currently flat, which signals a neutral trend rather than a bullish one. Like the equal-weighted S&P 500 index, mid caps successfully tested support in November and rebounded. The key question for this segment is whether stronger earnings fundamentals and moderate valuations can attract enough capital to force a technical breakout next year.
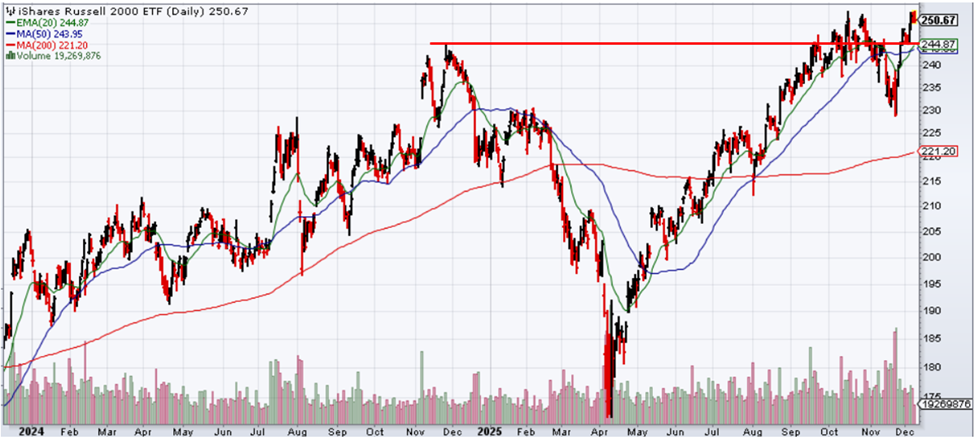
Russell 2000 (Small Cap) Index
Small cap stocks, or at least the Russell 2000 Index, have been a bit different than mid caps from a technical perspective. Unlike the mid cap index, the Russell 2000 Index was able to break above its November 2024 highs to set new records this year. Despite this achievement, the index has struggled to maintain that momentum more recently. A positive development is that the 200-day moving average has started to trend higher, providing a bullish signal and potential downside support.
Investors should be aware that the Russell 2000 Index contains several unprofitable, lower-quality companies that rallied significantly this year, helping to drive the index higher. It remains to be seen if higher-quality small cap companies can provide enough structural support to push the index higher in 2026.
FOREIGN EQUITIES
I have adjusted my outlook on foreign equities, shifting from moderately bullish to slightly bullish.
My change in view is primarily driven by valuation concerns following a significant rally across both foreign developed and emerging market stocks. While I continue to prefer maintaining exposure to these markets, the material discount that once made them highly attractive has dissipated a bit.
Given that foreign equities and currencies often suffer steeper declines than U.S. assets during periods of global stress, risk management is key. Following the strong rallies we have seen in foreign equities this year, it is prudent for me to become more neutral in my view.
Tactically, I have taken profits in foreign equities by reducing leveraged exposure to Chinese equities and diversified emerging markets as they rallied, though I maintain minor leveraged positions in these areas. I retain core exposure to emerging markets but prefer actively managed strategies that focus on high-quality, growing companies rather than broad passive, market cap-weighted index exposure.
The fundamental case for foreign equities remains supported by solid growth expectations. Forecasts for the MSCI All Country World ex USA Index suggest earnings growth in the low-to-mid double digits over both the short term (1 year) and long term (5 years). This anticipated growth can provide a sturdy foundation for continued investment in international equities.
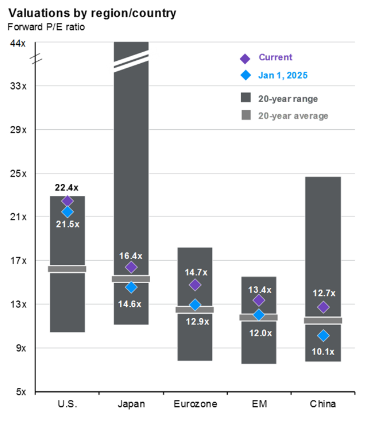
The new concern, though, is that valuations now warrant a more cautious approach. As seen in the following graph, the forward price-to-earnings (P/E) ratio for the ACWI ex USA Index is hovering around 15x, which places it near the higher end of its historical range. Looking back to 2002, the index has rarely traded above this valuation level. When I previously adopted a more bullish stance, these valuations were notably more attractive than they are today.
A similar trend is visible within emerging markets. The MSCI Emerging Markets Index is also trading at valuations that are elevated relative to its own history, as shown in the following graph. This higher valuation environment across both developed and emerging sectors is a key factor in my decision to reduce my bullishness to foreign equities at this time.

Currency movements play a crucial role in international returns for U.S. investors. The U.S. Dollar Index is lower this year but has rallied more recently and has remained range-bound between $96 and $100 for the past six months. A significant breakout from this range may require a strong fundamental catalyst, such as a shift in Federal Reserve policy or a global rush to safer currencies, of which the dollar continues to enjoy reserve currency status.
U.S. Dollar Index
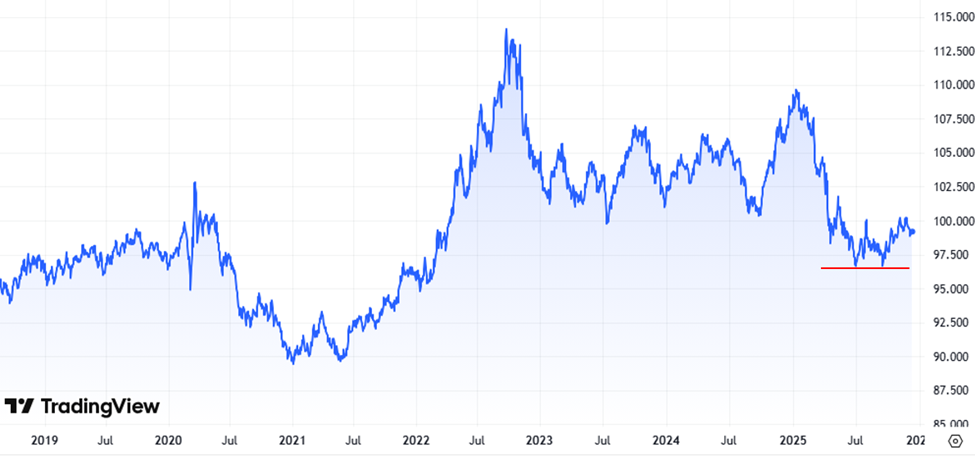
The dollar currently faces conflicting forces. On one side, positive capital flows into the U.S., driven by excitement surrounding artificial intelligence, support the currency. On the other side, high deficits, growing government debt, and the potential for a lower federal funds rate next year create headwinds. From a market technicals perspective, the index may need to break below the $96 level to signal a deeper decline, which it has yet to do.
For U.S. investors in foreign assets, a weaker dollar is generally beneficial because it boosts the value of foreign assets when converted back to dollars. However, given the current crosswinds, I am not counting on a significant move in either direction. This uncertainty, combined with the dollar’s decline earlier in the year alongside the rally in foreign stocks, further reduces my conviction in aggressive positioning in foreign equities at this time.
Market Technicals
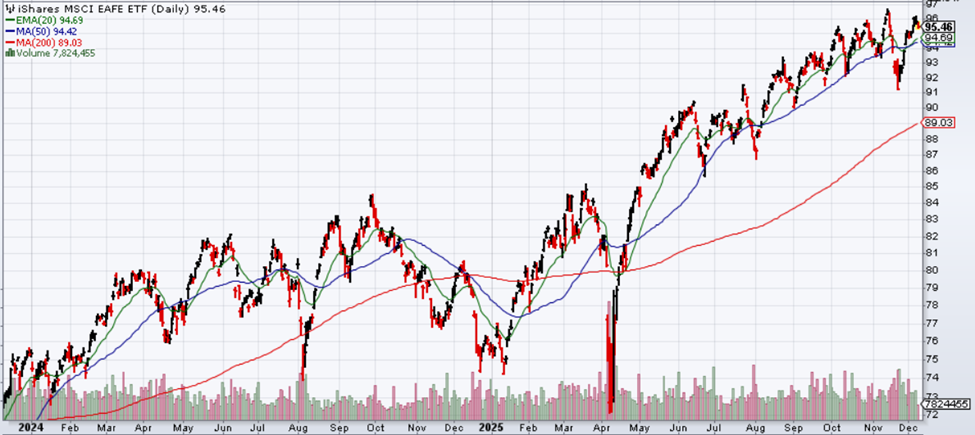
MSCI EAFE Index
The MSCI EAFE Index (proxied by the iShares MSCI EAFE ETF), a measure of developed countries’ stocks, remains in a bullish uptrend, supported by the strong performance following the pause in President Trump’s “Liberation Day” tariffs in April. While the rate of ascent has slowed recently, the 200-day moving average remains in a strong uptrend and could offer continued support heading into next year.
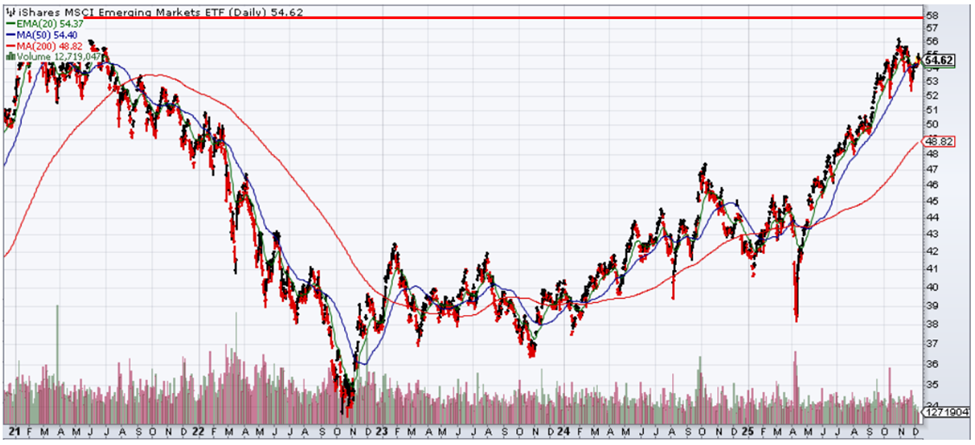
MSCI Emerging Markets Index
Emerging market equities (proxied by the iShares MSCI Emerging Markets ETF) have outperformed both the S&P 500 and the MSCI EAFE indices this year, yet they have not yet broken out above previous highs set in 2021. The rising 200-day moving average provides technical support, but after such a strong run, a period of consolidation may be necessary before these markets attempt to reach new highs.
HIGH INCOME

I remain moderately bullish on high income-generating assets and strategies.
With U.S. and international equities performing well throughout 2025, valuations appear elevated, particularly among larger market capitalization companies. If global equity markets enter a period of technical consolidation or experience a meaningful fundamental decline, the steady cash flow from income generation could prove beneficial.
To navigate the current market environment, I utilize tactical, multi-asset income strategies to gain diversified exposure across credit-sensitive corporate and securitized bonds, emerging market debt, global dividend growth companies, option income, and closed-end funds. By combining these asset classes, yields exceeding 6% can be realized. This creates a substantial carry that helps offset price volatility.
This approach also allows for tactical shifts as market conditions evolve. If we encounter periods of heightened volatility where equity markets decline materially from current levels, I would consider taking advantage of the opportunity by adding to equities with a corresponding reduction in these high income strategies.
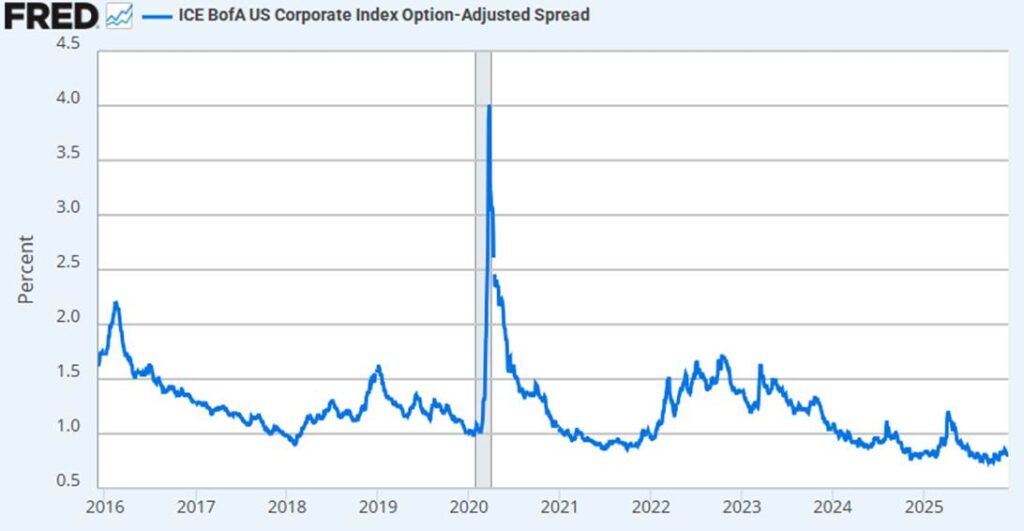
A fundamental concern I have is that credit spreads in below investment grade bonds, often referred to as high yield, remain tight relative to historical averages, as shown in the following graph. Tight spreads imply that investors are receiving less compensation for taking on credit risk.
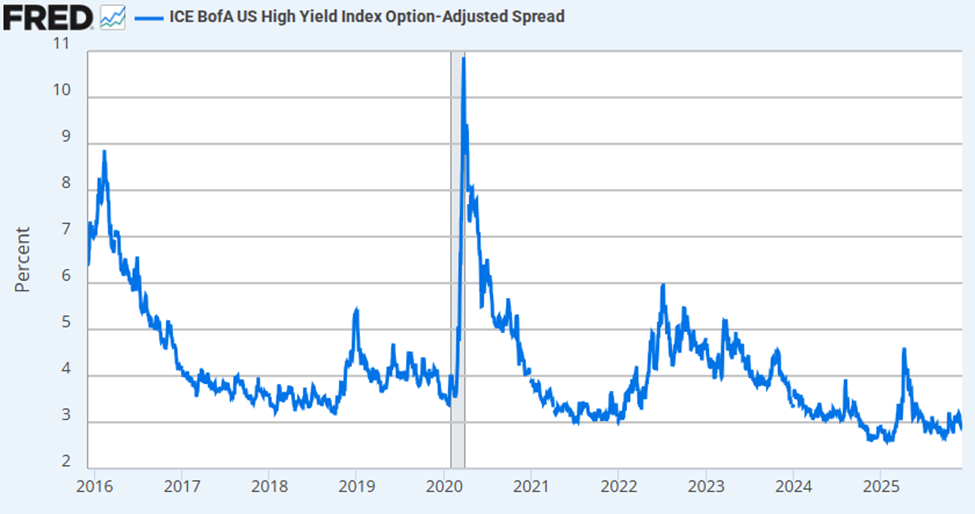
At this point, I am willing to accept these tighter spreads and elevated valuations because I believe valuations in U.S. large cap equities may be even more extended and technically overbought. Below investment grade bonds can provide a yield buffer and historically exhibit lower volatility than equities. This can provide some complementary diversification to a portfolio otherwise heavily allocated to pure equity exposure.
Closed-End Funds
I consider myself only slightly bullish on closed-end funds at this time. I continue to maintain exposure to closed-end funds, although valuations aren’t great here either as discounts to net asset value (NAV) are also relatively tight. It is important to remember that closed-end funds often utilize leverage, which adds an additional element of risk and potential volatility during periods of rising interest rates (cost of leverage) or market stress.
While I generally maintain exposure to closed-end funds, my current allocation is somewhat underweight. I would be more inclined to increase exposure in an environment where discounts to NAV were deeper, credit spreads were wider, and global equity markets were not trading close to new highs.
COMMODITIES
I remain slightly bullish on commodities overall. While fundamental supply and demand imbalances are driving specific commodity sectors, I continue to lean heavily on market technicals to guide my views on potential price direction in this environment.
Gold
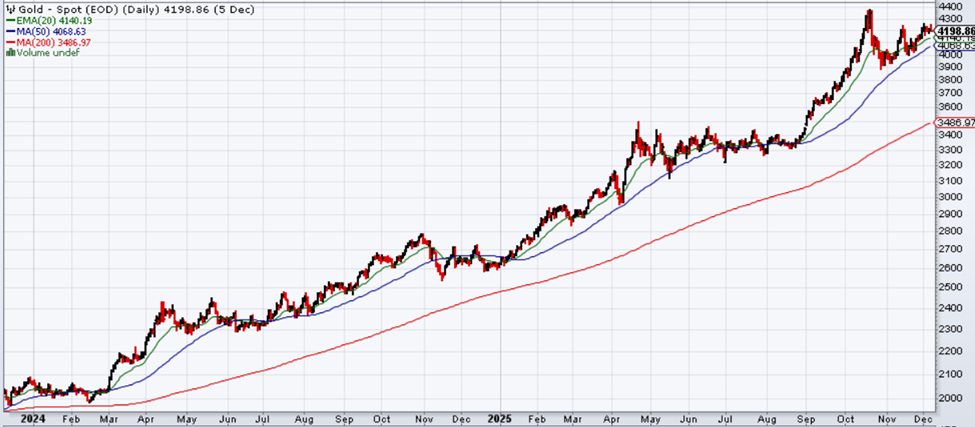
Gold has continued to defy gravity and has rallied consistently throughout the year. Gold has been one of the strongest investments of 2025 with a staggering 58% return year-to-date through December 5. The “yellow rock” continues to exhibit highly supportive market technicals. It is currently trading firmly above its 50-day moving average with a rising 200-day moving average below current prices. It’s also notable that the long-term 200-day moving average is now positioned above the price consolidation zone we saw from April through September. This provides additional support that the long-term trend remains upward.
In the immediate term, $4,400 per ounce appears to be the critical resistance level. Gold needs to break above this price and sustain that level to confirm another potential leg higher. Because the metal has yet to show signs of breaking its upward trend, I remain passively bullish on gold at this time.
I do not specifically invest in or trade gold, but the contrarian investor in me suggests caution. From a purely technical perspective, we could see a target of $5,000 per ounce next year. After such a massive rally this year, it would be difficult for me to chase gold prices with new capital. If I was invested in gold, I would be inclined to take profits from this rally and reallocate that capital into other higher quality assets that generate earnings or cash flow.
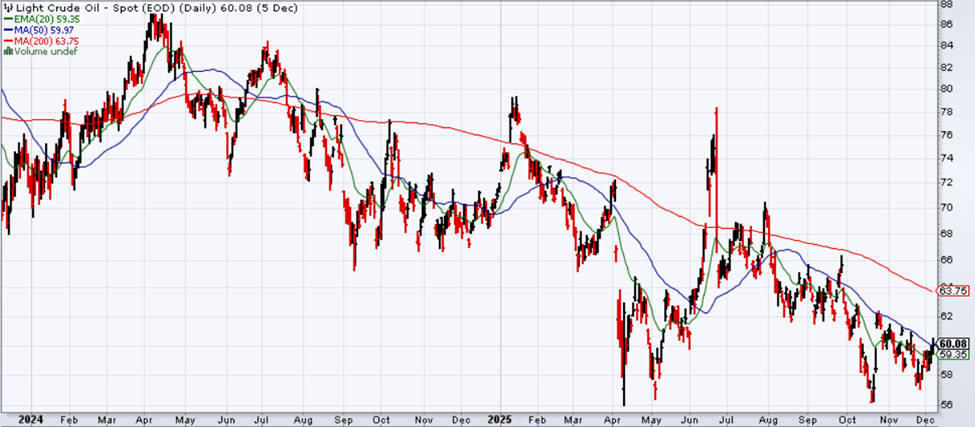
WTI Crude Oil
In contrast to precious metals, WTI Crude Oil prices have continued to grind lower over the past two years. The fundamental picture is dominated by an elevated global oil supply that is anticipated to persist into 2026. OPEC+ countries, led by Saudi Arabia and Russia, alongside the United States, have ramped up production to a point where supply exceeds immediate global demand. This imbalance is placing downward pressure on energy prices.
WTI Crude Oil has historically generally traded in the $60 to $90 range on average. Within the current environment of weak price technicals and continued oversupply, prices could break below the $60 lower bound next year.
Despite the bearish trend, there is likely a fundamental floor for oil prices. It may be difficult to sustain prices significantly lower than $50 to $55 per barrel because higher-cost producers in the U.S. generally do not find it profitable to drill at those levels. If prices dip that low, production could naturally come offline. This natural economic force of producer profitability and supply rationalization should prevent oil prices from remaining sustainably lower than the mid-to-low $50s per barrel level.
If we get oil supply shocks or global demand picks up from current levels, oil prices could stage a turnaround to the upside. Given the lower current price levels and that oil prices have historically traded higher in better times, I’m currently moderately bullish on oil prices over the intermediate-term.
CONSERVATIVE ASSETS
I maintain a slightly bullish outlook on conservative assets at this time.
Bonds have delivered solid performance throughout the year as higher income generation and spread compression have benefited credit-sensitive, intermediate-term bonds.
For conservative bond exposure, I continue to favor actively managed bond strategies. Investment managers with the flexibility to allocate across bond sectors, credit quality, and duration are essential in this environment. Managers capable of exploiting idiosyncratic opportunities are particularly favorable given the current tight credit spreads.
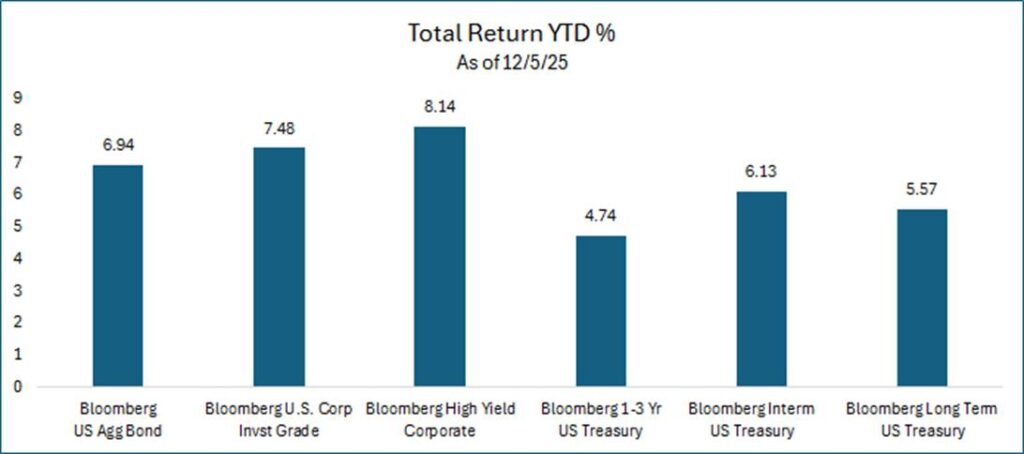
For investors seeking income, bonds continue to offer moderately attractive absolute yields and even stronger yields the farther you go out the risk curve, as shown in the following chart.
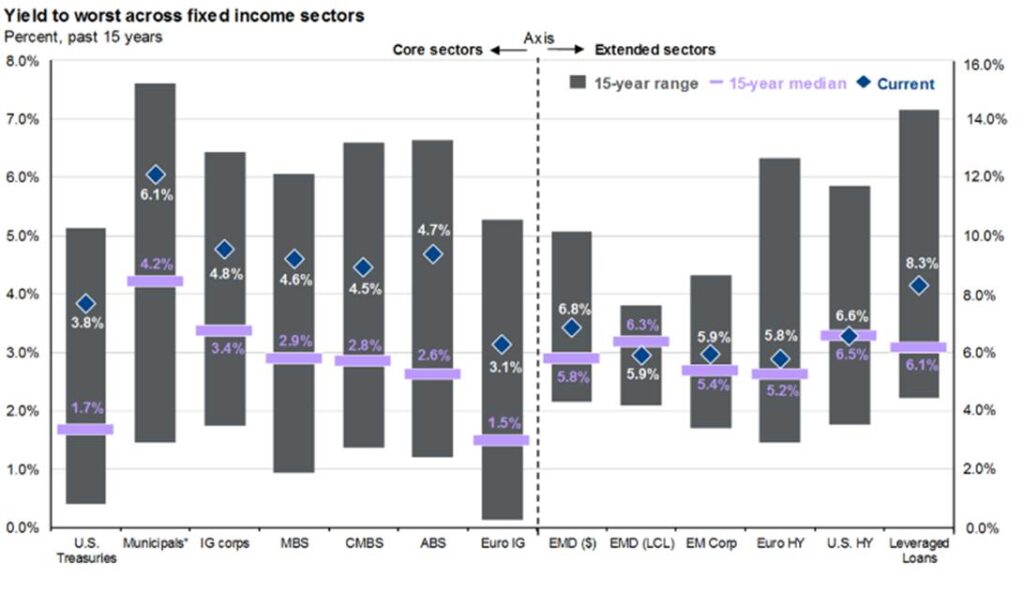
Current market conditions show that credit spreads are tight. This implies that further spread compression may be difficult to achieve in the coming year. Going forward, bond market performance may be defined primarily by income generation rather than price appreciation.
Given this environment, my preference is to remain diversified across sectors and credit quality. I am maintaining reduced exposure to below-investment-grade bonds within my conservative asset allocation to mitigate risk.
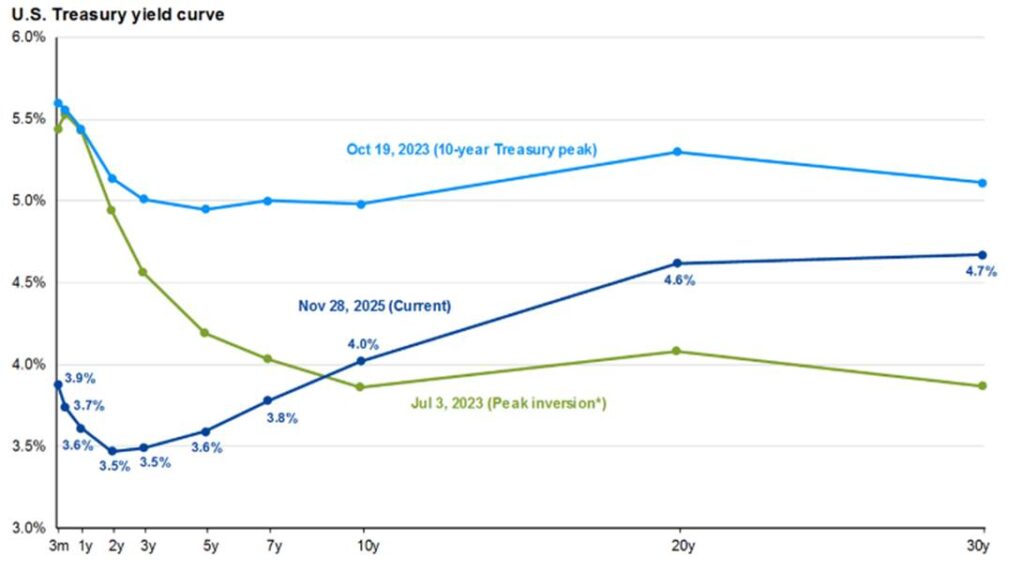
Yield Curve
Interest rates display distinct dispersion along the yield curve. The front end has declined as the Federal Reserve cuts interest rates, and this trend is anticipated to continue. The short end of the curve is heavily influenced by the Fed’s decisions on the federal funds rate. However, with inflation currently hovering in the 2.5% to 3% range, notably above the Fed’s 2% target, central bankers may lack the pressure or justification to cut rates significantly lower from current levels.
The long end of the yield curve faces a different set of drivers. It is influenced heavily by future inflation expectations and the bond market’s confidence in the United States’ ability to service its debt. The U.S. government debt level is roughly $38 trillion with no indications of slowing. This massive supply of government debt means the long end of the yield curve may struggle to decline and could face upside pressure going forward if investors demand a premium to hold long-term U.S. debt.
I prefer to remain neutral on duration relative to core bonds and favor the 4-year to 7-year maturity range. Yields in this maturity bucket are attractive relative to the short end of the curve. If the Fed continues to cut rates and the yield curve trends downward, these interest rate-sensitive bonds have the potential to rally.
In addition, should equity markets suffer a material decline, investors often rush to the safety of bonds. In that scenario, interest rate-sensitive bonds tend to perform well. Another distinct benefit of holding intermediate-term bonds is the potential for price appreciation via “rolling down the curve” as time passes and the bonds move toward maturity.
As noted in previous commentaries, the 10-year Treasury yield may remain within a 3.5% to 4.5% trading range, which is where we currently sit. From a technical perspective, if the 10-year yield approaches the 5% resistance level, I would look to add duration. Conversely, if yields drop toward the 3.5% support level, I would likely look to decrease duration.
10-Year Treasury Bond Yield

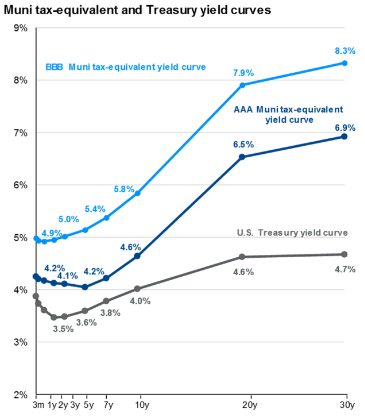
Potential Opportunities in Municipal Bonds
For investors in high income tax brackets, municipal bonds currently offer compelling value. Municipal bonds along the yield curve offer higher yield premiums to U.S. Treasuries on a tax-equivalent basis than they have historically, on average. This could be a key consideration for high income investors seeking tax-exempt income.
U.S. GOVERNMENT BONDS
I maintain a slightly bullish outlook on U.S. government bonds in the current environment.
I typically find it challenging to heavily favor U.S. Treasuries because the broader bond universe usually offers more diverse opportunities for yield generation. However, current tight spread valuations across credit-sensitive bonds suggest some caution is warranted.
From a fundamental valuation standpoint, you are simply not being paid enough right now to take on significant credit risk. When the economy is strong and defaults are low, tight spreads are normal. However, if macroeconomic volatility increases, those tight spreads offer very little cushion to absorb a downturn.
For investors who prioritize capital preservation and are conscious of valuations, U.S. Treasuries are currently a suitable option. They can provide a safe harbor with limited volatility relative to the credit markets. If you are looking to anchor the fixed income portion of your portfolio without exposing yourself to the pricing risks currently inherent in corporate bonds, increasing exposure to government debt could be a prudent tactical move.
Despite the relative potential safety of Treasuries, I continue to prefer to accept calculated risk through exposure to diversified, active bond managers.
U.S. INVESTMENT GRADE CREDIT
I maintain a slightly bullish stance on investment grade credit in the current environment. I do retain some concern due to tight valuations across credit-sensitive bonds.
From a fundamental perspective, corporate balance sheets remain relatively healthy, but the market has priced in a significant amount of good news. We briefly witnessed a tactical opportunity to increase credit exposure a bit in March and April of this year when volatility caused credit spreads to widen. That window has since closed as valuations have returned to these tight valuation levels. Going forward the potential for capital appreciation due to further spread compression may be limited.
Given this backdrop, I prefer an active rather than passive approach to fixed income. Passive strategies that simply track an index are forced to buy bonds regardless of price or quality, and that is rarely an attractive option for me.
My preference is to allocate capital to active bond managers who possess the flexibility to look beyond traditional corporate bonds. There can be stronger relative value opportunities found in investment grade securitized sectors, such as residential mortgage-backed securities (RMBS), commercial mortgage-backed Securities (CMBS), and asset-backed securities (ABS). These sectors can offer attractive yields and diversification benefits that plain corporate credit may lack at this moment.
Ultimately, I think this could be an environment where patience is a virtue. I will let the market come to me rather than stretching for risk and chasing returns. In my conservative allocation, my preference is to preserve capital and wait for better entry points rather than taking unnecessary risks for potentially only marginal gains.
OTHER
I use this section to talk about other potential strategies, generally whether or not hedges are needed on asset classes.
I remain slightly bullish on non-traditional and investment hedging strategies at this time.
As we approach the new year, the broader macroeconomic landscape suggests a distinct opportunity for diversification beyond standard equity and fixed-income allocations.
The global economy is anticipated to remain relatively solid throughout 2026. Earnings growth in the U.S. is projected to be strong, which serves as a fundamental pillar for asset prices. This backdrop creates a supportive environment for risk assets, particularly through the first half of the year.
However, investors should remain aware of the political calendar. As we move deeper into 2026, the focus will inevitably shift toward the U.S. mid-term elections. Historically, mid-term election years can introduce policy uncertainty and increased volatility in the months leading up to the vote. By the latter half of the year, market participants will likely begin discounting expectations for 2027, potentially altering the risk-reward dynamic and positioning across asset classes.
From a valuation perspective, the market is currently bifurcated. While the artificial intelligence sector commands premium pricing, equity valuations outside of the AI-related space are only slightly elevated globally. For me, there is little immediate pressure to be overly hedged in broader equity markets, as prices generally align with historical averages relative to earnings potential.
We see a similar dynamic in the fixed-income markets. Credit spreads remain tight, which typically implies that corporate bonds are expensive relative to Treasuries. Yet, given the supportive earnings data and a resilient economic backdrop, the credit risk remains low. Being significantly hedged on credit exposure does not appear necessary at this time because the fundamental drivers of default risk appear limited and manageable.
Looking ahead, technical indicators suggest that risk assets may continue to grind higher in the near term. Momentum remains favorable, at least for now.
I continue to remain patient. My patience waiting for the March/April risk asset decline to add to risk exposure worked well this year. I’ll continue to wait for a more favorable environment to add to risk again, but without significant hedges in place at this time.
As we navigate the first part of next year, I’ll keep an eye on price momentum, market technicals and valuations. If asset prices extend too far beyond their moving averages or if sentiment becomes euphoric, I may consider implementing hedges on risk assets at that time.
For now, I’m keeping my relatively neutral positioning across risk assets, favoring higher income-generating assets, and will just wait for an opportunity to jump on wherever and whenever that may occur.

Eric Kulwicki, CFA®, CFP®, brings 20+ years of experience, currently serving as an independent investment consultant, portfolio manager, and wealth advisor for institutional and retail clients. On KulwickiInsights.com, Eric shares his timely perspectives on financial markets, investment strategies, and other financial topics. He also offers online investment education courses for beginner and intermediate investors, and coaching sessions for DIY investors seeking professional guidance.