
Equity and Bond Markets Continue to Rally Higher in Q3
Investors enjoyed solid performance from global equity and bond markets in Q3 as the global economy and corporate earnings continued to show growth, emboldening investors to embrace risk.
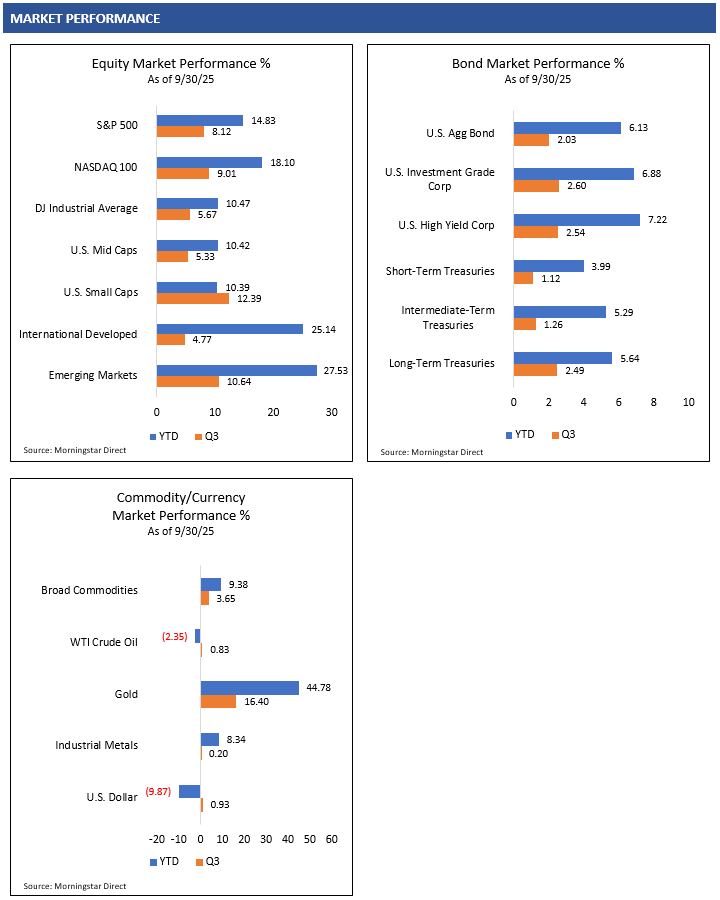
The S&P 500 Index returned 8.12% and the MSCI ACWI ex USA Index, which measures international developed and emerging markets stocks’ performance, returned 6.89% in Q3.1 Bonds were also strong in Q3, as higher yields continue to support total return performance. The Bloomberg U.S. Aggregate Bond Index, a multi-sector, investment grade, intermediate-term bond index, was up 2.03% in Q3, with credit-sensitive bonds generally outperforming U.S. Treasuries.1
Political Uncertainty Continues to Impact Investors
On July 4, 2025, President Trump signed the One Big Beautiful Bill Act into law, making permanent certain tax cuts originally enacted in 2017 that were set to expire, extending others and adding new tax cut provisions. While the bill was widely anticipated to pass, it removed one factor of uncertainty for investors and was generally bullish overall.
Tariffs have been a persistent factor that investors have been trying to navigate. In Q3, President Trump announced trade deals with different trade partners, but the tariffs are now being challenged by the federal courts. Investors are waiting for a ruling from the U.S. Supreme Court to determine whether the existing tariffs can remain or if changes need to be made. Investors will need to determine any potential pros (lower inflation) or cons (less tariff revenue) from the Supreme Court’s decision and any follow-through tariff legislation that Congress may need to enact.
On October 1st, the U.S. Congress failed to approve federal legislation to fund government operations. This can cause a halt in “non-essential” government activities until spending legislation is approved. Until then, government workers may be furloughed, and worker pay may be temporarily halted.
The last U.S. government “shutdown” occurred in late December 2018 and lasted for 35 days, which was a record length of time. Financial markets have historically been able to view these shutdowns as temporary, with government services resuming and worker pay ultimately restored in relatively short order. With what appears to be a deep divide between Republicans and Democrats in Congress, it is uncertain as to the potential compromises that will need to be made and how long the shutdown will last. The longer the shutdown period, the more concern investors may have, and market volatility could pick up from current sanguine levels.
U.S. Federal Reserve Cuts Interest Rates as Anticipated
On September 17th, the Federal Open Market Committee resumed its monetary easing policy and cut the fed funds rate 25 basis points (0.25%) to a target range of 4.0%-4.25% as widely expected. The FOMC last cut the fed funds rate by 25 basis points in December 2024. Fed funds futures are pricing in one or two more 25 basis point cuts before the end of the year, with the next FOMC meeting set for late October.
As shown in the following chart, FOMC members believe the fed funds rate will continue to trend lower toward 3%. With the fed funds rate currently above 3%, the Fed’s monetary policy could be viewed as restrictive, and more rate cuts could be coming.
FOMC Fed Funds Rate Forecast
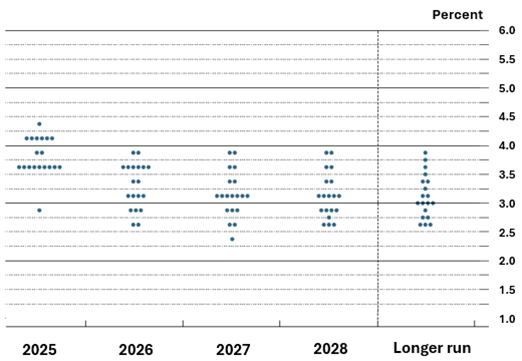
The Fed appears to have a tighter focus on the health of the jobs market and may be viewing current elevated inflation levels as transitory. Weekly jobless claims have been steadily increasing the last two years, which may be some indication of softness in the labor market. The Fed prefers to support a healthy labor market and not fall behind if the economy materially slows from this point. Although job growth has been decelerating, it has not yet had a significant negative effect on the U.S. economy.
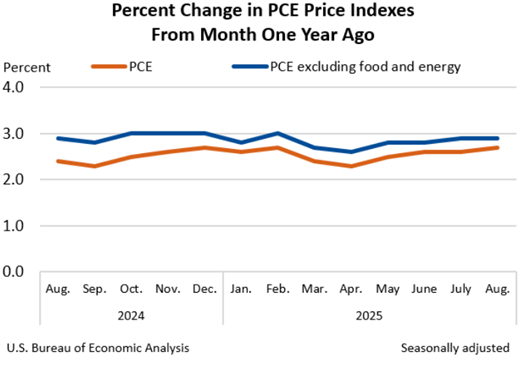
Inflation appears somewhat anchored around 2.5-3% for now, with prices continuing to move higher for businesses and consumers without much relief. While the full effects of the tariffs have yet to fully work their way through the economy, inflation has remained steady at a persistent 2.5–3% rather than jumping significantly higher. The Personal Consumption Expenditures (PCE) Price Index is still above the Fed’s 2% target, which may continue to discourage the Fed from pursuing aggressive cuts to the fed funds rate.
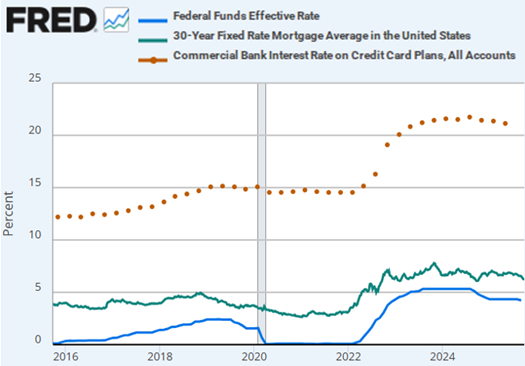
The Fed tries to manage liquidity in the economy by adjusting the fed funds rate, which is an overnight lending rate for banks. The fed funds rate can indirectly impact other interest rates, but market dynamics and bond investors can drive other consumer-related interest rates, including mortgages and other debt (auto loans, credit cards, etc.).
For consumers to feel the benefit of lower interest rates, consumers will want to see consumer-related interest rates come down from current levels and a decline in the fed funds rate will not be enough to do so alone. As shown in the following chart, mortgage and credit card rates have yet to see a material decline.
Moderate Economic Growth Anticipated to Continue
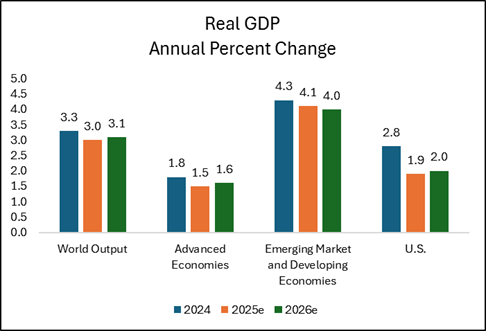
The U.S. economy has been resilient, with a final Q2 real GDP growth reading of 3.8%.7 Globally, the International Monetary Fund forecasts global real GDP growth of 3.1% in 2026 across advanced and emerging market economies.8 Heightened geopolitical risk remains, but a persistent moderate global growth environment could be healthy support for investors going into next year.
While political rhetoric seems to be elevated and driving headlines, investors continue to focus on investment fundamentals and earnings growth as equity prices tend to follow earnings over longer periods of time. Earnings growth both within and outside the U.S. is forecasted to be strong next year. The U.S. was the bright spot in earnings growth this year, but growth may also start to accelerate internationally.
Investors position portfolios in anticipation of the future, and next year’s strong global earnings estimates may have resulted in the already strong performance for U.S. and international equities this year. If global growth can continue, investors may continue to support global equities into next year.

Concentrated Market Cap-Weighted Index Exposure
Investors passively invested in U.S. large cap indices such as the S&P 500 and NASDAQ 100 are faced with potential concentration risk in these indices. As shown in the following chart, the S&P 500 Index’s top 10 companies in market cap now account for roughly 40% of the index. These top 10 companies include Microsoft, Apple, Alphabet (Google), Meta (Facebook), Amazon and NVIDIA, which have been strong, high-quality technology companies with stock prices that have already appreciated considerably over time.
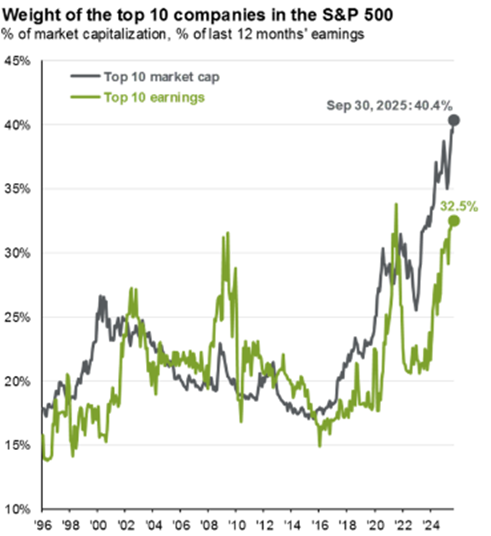
While these companies’ fundamentals and stock price strength could persist, investors in the S&P 500 Index should be aware of this concentration risk and thoughtfully explore opportunities for diversification.
Q3 Market Review
Equity Markets
Global equity markets continued to rally higher in Q3 as investors embraced riskier areas of the markets. In the U.S., small caps, growth stocks, and more momentum-driven and speculative stocks generally outperformed. Outside of the U.S., emerging markets outperformed developed markets.
With the U.S. economy and corporate earnings delivering growth, investors continued to support U.S. equity markets. In Q3, the S&P 500 Index rallied 8.12% and the technology-heavy NASDAQ 100 Index rallied 9.01%.1 The Russell 2000 Index, which measures the performance of smaller U.S. companies, outperformed large caps in the quarter, rallying 12.39%.1
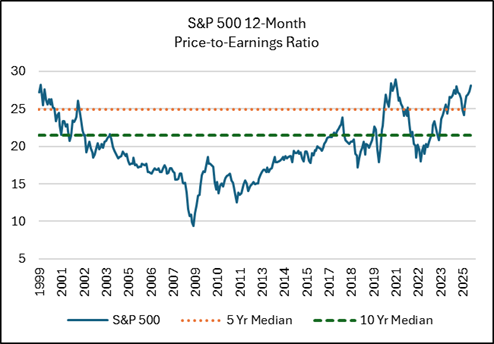
A near-term challenge for investors is that valuations of U.S. large caps appear extended on a historical basis. The following chart shows the 12-month historical price-to-earnings ratio of the S&P 500. Current valuations are higher than their five- and 10-year historical averages, which may be a concern for valuation-conscious investors.
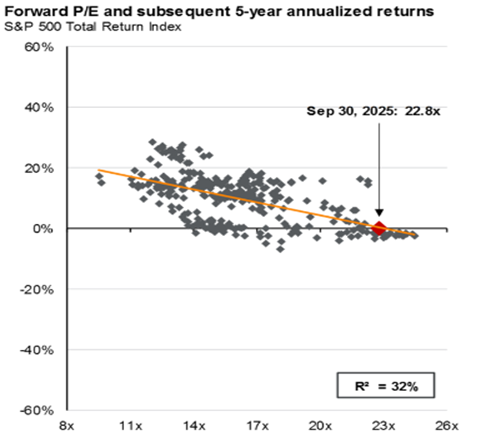
Given today’s higher starting valuations, investors may need to adjust their future investment return expectations lower as valuation expansion may not be a key driver of returns as they have been thus far. The chart below shows historical performance of the S&P 500 Index given its starting forward price-to-earnings ratio. At least historically and based on a current forward P/E ratio of 22.8x, subsequent 5-year annualized returns for the S&P 500 Index were muted.
Foreign equity markets also continued to show strength in the quarter. The MSCI EAFE Index, which measures the performance of developed countries’ stocks, rallied 4.77% in Q3, and is up 25.14% year-to-date through the end of the quarter.1 The MSCI Emerging Markets Index outperformed developed markets in the quarter, rallying 10.64% and is now up 27.53% year-to-date through the end of Q3.1 Year-to-date through the end of Q3, both the MSCI EAFE and MSCI Emerging Markets indices have outperformed the S&P 500 and NASDAQ 100 indices.
With global economic and corporate earnings growth anticipated to continue through next year, this backdrop could continue to drive investors to support global equities.
Bond Markets
Bonds performed well in Q3 as investors were positioned for Fed rate cuts and moderate economic growth. Bond yields shifted lower on the front end of the yield curve and credit spreads tightened in the quarter, acting as positive tailwinds for bond investors.
The Bloomberg U.S. Aggregate Bond Index, an investment grade, intermediate-term bond index, returned 2.03% in the quarter.1 Investors willing to take on additional credit risk were rewarded in Q3, with the Bloomberg U.S. Corporate Investment Grade Index up 2.60% and the Bloomberg High Yield Corporate Index up 2.54%.1
Credit-sensitive bond valuations may be a bit elevated at current levels. Credit spreads have fallen substantially from the spike experienced in March and April this year and from higher levels back in 2021 and 2022 as shown in the following chart. A credit spread represents the yield difference between a bond and a risk-free bond, like U.S. Treasuries, compensating investors for taking on additional credit risk. Given current credit spreads, bond investors are being compensated less for the additional credit risk than they were in the past.
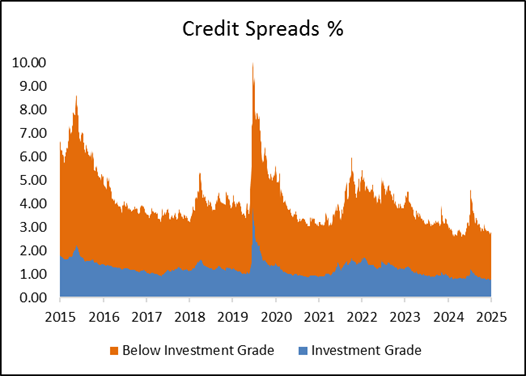
Bond investors will need to determine whether currently lower credit spreads are appropriate in this environment. With no clear signs of weakness in the U.S. economy and expectations of further rate cuts by the Federal Reserve, investors may opt to maintain credit exposure despite elevated valuations.
Commodity Markets
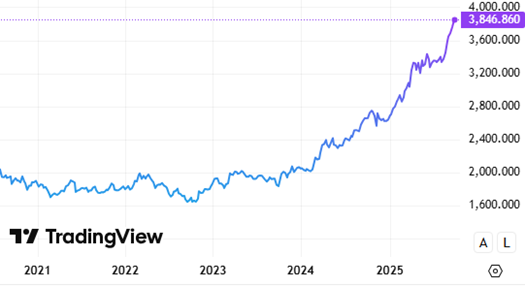
Gold continued to rally to new highs in Q3, up 16.40% and approaching $4,000 per ounce. Gold is now up 44.78% year-to-date through the end of the quarter.1
Gold prices often rise in tandem with heightened uncertainty, elevated inflation, currency depreciation, and declining interest rates. Momentum can further fuel this trend, as traders and investors entering late seek to capitalize on the rally. Going forward, investors must assess whether underlying fundamentals and sustained momentum are sufficient to drive gold higher or if a potential catalyst could trigger a reversal.
Gold Price
WTI Crude Oil traded in the mid-to-low $60s per barrel in Q3, with lower price volatility than experienced in Q2. Global oil supply remains ample enough to meet demand at these levels and catalysts have not yet emerged to push oil prices materially higher or lower from this trading range. Unless there is a supply disruption or global demand increases or decreases materially, oil may continue to trade within its current range.
Currency Markets
The U.S. Dollar Index rose 0.93% in the quarter, slightly reversing its downward trend this year.1 Year-to-date through the end of Q3, the U.S. Dollar Index has declined 9.87%.1
The U.S. dollar is often driven by interest rate expectations and economic growth differentials relative to other countries. Investors will continue to navigate inflation and economic growth expectations in the U.S. relative to the rest of the world and position themselves across global currencies accordingly.
SOURCES
- Morningstar Direct. Performance provided as total returns. U.S. Mid Caps is defined by the Russell Mid Cap TR USD index. U.S. Small Caps is defined by the Russell 2000 TR USD index. U.S. Growth is defined by the Russell 3000 Growth TR USD index. U.S. Value is defined by the Russell 3000 Value TR USD index. International Developed is defined by the MSCI EAFE NR USD index. Emerging Markets is defined by the MSCI Emerging Markets NR USD index. U.S. Agg Bond is defined by the Bloomberg U.S. Aggregate Bond TR USD index. U.S. Investment Grade Corp is defined by the Bloomberg U.S. Corporate Investment Grade TR USD Index. U.S. High Yield is defined by the Bloomberg High Yield Corporate TR USD index. Broad Commodities is defined by the Bloomberg Commodity TR USD index. WTI Crude Oil is defined by the Bloomberg Sub WTI Crude Oil TR USD Index. Gold is defined by the Bloomberg Sub Gold TR USD Index. Industrial Metals is defined by the Bloomberg Sub Industrial Metals TR USD Index. Short-Term Treasuries defined by the Bloomberg 1-3 Yr U.S. Treasury TR USD index. Intermediate-Term Treasuries defined by the Bloomberg Intermediate U.S. Treasury TR USD Index. Long-Term Treasuries defined by the Bloomberg Long-Term U.S. Treasury TR USD Index.
- Federal Open Market Committee. Summary of Economic Projections. September 17, 2025.
- U.S. Bureau of Economic Analysis. Personal Income and Outlays, August 2025. Retrieved from https://www.bea.gov/news/2025/personal-income-and-outlays-august-2025
- Board of Governors of the Federal Reserve System (US), Federal Funds Effective Rate [FEDFUNDS], retrieved from FRED, Federal Reserve Bank of St. Louis; https://fred.stlouisfed.org/series/FEDFUNDS, September 2025
- Freddie Mac, 30-Year Fixed Rate Mortgage Average in the United States [MORTGAGE30US], retrieved from FRED, Federal Reserve Bank of St. Louis; https://fred.stlouisfed.org/series/MORTGAGE30US, September 25, 2025
- Board of Governors of the Federal Reserve System (US), Commercial Bank Interest Rate on Credit Card Plans, All Accounts [TERMCBCCALLNS], retrieved from FRED, Federal Reserve Bank of St. Louis; https://fred.stlouisfed.org/series/TERMCBCCALLNS, May 2025.
- U.S. Bureau of Economic Analysis. Gross Domestic Product, 2nd Quarter 2025 (Third Estimate), GDP by Industry, Corporate Profits (Revised), and Annual Update. Retrieved from https://www.bea.gov/news/2025/gross-domestic-product-2nd-quarter-2025-third-estimate-gdp-industry-corporate-profits
- International Monetary Fund. IMF World Economic Outlook July 2025. Retrieved from https://www.imf.org/en/Publications/WEO/Issues/2025/07/29/world-economic-outlook-update-july-2025
- JPMorgan. 4Q 2025 Guide to the Markets. September 30, 2025.
- Morningstar Direct. S&P 500 12-Month Trailing Price-to-Earnings Ratio. As of November 1999 – September 2025.
- Ice Data Indices, LLC, ICE BofA US Corporate Index Option-Adjusted Spread [BAMLC0A0CM], retrieved from FRED, Federal Reserve Bank of St. Louis; https://fred.stlouisfed.org/series/BAMLC0A0CM.
- Ice Data Indices, LLC, ICE BofA US High Yield Index Option-Adjusted Spread [BAMLH0A0HYM2], retrieved from FRED, Federal Reserve Bank of St. Louis; https://fred.stlouisfed.org/series/BAMLH0A0HYM2.
- TradingView.com. Gold. Retrieved from https://www.tradingview.com/chart/?symbol=TVC%3AGOLD as of September 30, 2025.

Eric Kulwicki, CFA®, CFP®, brings 20+ years of experience, currently serving as an independent investment consultant, portfolio manager, and wealth advisor for institutional and retail clients. On KulwickiInsights.com, Eric shares his timely perspectives on financial markets, investment strategies, and other financial topics. He also offers online investment education courses for beginner and intermediate investors, and coaching sessions for DIY investors seeking professional guidance.