
Equity Markets Rebound on U.S. Tariff Pause in Q2
Global equity markets were volatile in Q2, coinciding with President Trump’s tariff rates announcement and the subsequent pause in early April.
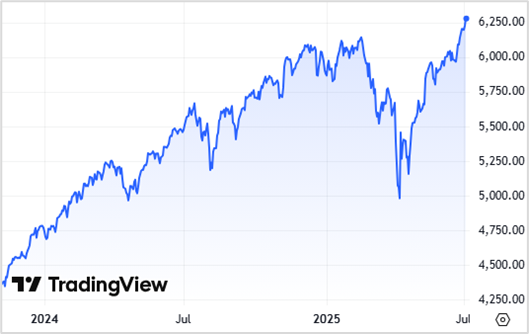
Coming into Q2, equity markets were in decline as investors anticipated President Trump’s tariff “Liberation Day” announcement on April 2nd. When announced, the new tariff rates were higher than many anticipated. In retaliation, China and the European Union announced their own tariffs on the U.S., which spooked investors, causing equity markets to decline sharply. From its peak in February, the S&P 500 Index declined roughly 21%.1
Shortly thereafter, on April 9th, President Trump announced a 90-day pause on implementing his tariff policy. Financial markets reacted favorably to the pause, with equities and other risk assets rebounding significantly from their lows. From its April low, the S&P 500 Index rallied approximately 28% to end Q2, and has since reached new highs.1
S&P 500 Index
U.S. Fiscal Policies Remain Key Factors to Watch
In the first quarter, business, consumer and investor confidence showed signs of weakening as uncertainty about President Trump’s tariff and tax policy weighed on confidence. Weaker confidence can translate into conservative spending decisions and can result in a slowing of the economy. Recent data has indicated some slowing of economic growth.
If clarity on U.S. government fiscal policies and their impact on the economy can improve, businesses and consumers may have greater confidence in their outlook. This could then translate to increased spending, investment, and general economic activity.
Tariff Policy
The 90-day pause on tariffs is set to expire on July 9th, with a potential tariff implementation date of August 1st. It is still uncertain whether deals will be reached, the current deadline will remain, the original Liberation Day tariff rates will be reinstated, or entirely new tariffs will be announced. The Trump administration has announced tariff frameworks for some countries, including China and the United Kingdom, but the full economic implications are still unknown.
Although the U.S. still does not have firm tariff policies in place for every country, President Trump has indicated that the ultimate tariff levels could be less than what was originally announced in early April. If tariffs end up being more manageable for companies and consumers, the global economy could remain on a stable growth path.
Tax & Budget Policy
President Trump and the Republican-led Congress passed the bill Republicans have called the “One Big Beautiful Bill”. This bill extends and makes permanent several tax cuts originally enacted in the 2017 Tax Cuts and Jobs Act, which were set to expire at the end of this year. Failure to extend the tax cuts could have had a negative impact on the U.S. economy as tax rates would have increased, raising the tax expense of many Americans and businesses.
Now that the bill has passed, investors may shift some focus to the federal deficit and rising U.S. debt levels. Investors will be watching for potential federal spending cuts that fiscal conservatives in Congress may have pushed for in return for their vote on the tax bill. Federal spending is a key component of U.S. economic growth and if federal spending is cut significantly, it can negatively impact the U.S. economy.
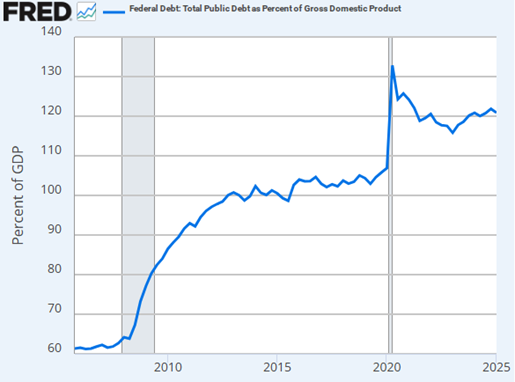
U.S. politicians appear to be increasingly concerned with the growing U.S. federal debt. The U.S. has been running higher budget deficits for years, resulting in the U.S. total debt level exceeding $36 trillion, roughly 120% of GDP as of Q1 2025.3 Although politicians have raised concerns about unsustainable debt levels, it remains unclear whether meaningful fiscal policies will be enacted to reduce the risks of high U.S. debt.
Federal Debt as % of GDP
If the U.S. cannot effectively control the federal budget deficit through higher revenues and/or lower spending, investors may become cautious on U.S. bonds. This could push interest rates higher and potentially hurt the U.S. economy.
Foreign Policy
The second quarter also marked heightened conflict between Israel and Iran in the Middle East. The United States also became involved in the conflict, by the targeted bombing of Iranian nuclear-related sites to prevent Iran’s development of a nuclear weapon. If the risk of Iran developing a nuclear weapon has been dramatically reduced, global investors could see this as a bullish backdrop over the short term.
The U.S. economy is heavily driven by U.S. consumer spending. Recent conflicts in the Middle East and elsewhere have generally had limited impact on U.S. financial markets and the economy. Although foreign conflicts can bring global uncertainty and short-term shocks to financial markets, investors have tended to look past these conflicts and focus on the long-term potential of the U.S.
Economic and Corporate Growth Remains Stable
While U.S. fiscal policies have yet to be fully resolved, economic and corporate growth remains fairly stable. Although political and economic uncertainty remains, it does not appear severe enough to significantly weaken economic activity. The strong rebound in global equity and credit markets may have reflected that view as well.
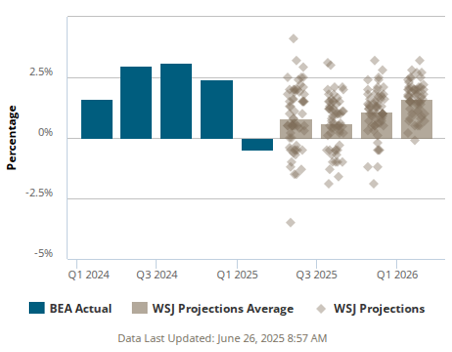
In Q1 2025, U.S. real GDP posted a negative 0.5% reading, indicating a slight contraction in the U.S. economy.5 Based on the projections of economists in the Wall Street Journal Economic Forecasting Survey, U.S. real GDP is projected to reaccelerate in Q2 and continue to show growth into 2026.
U.S. Real GDP Actual and Forecast
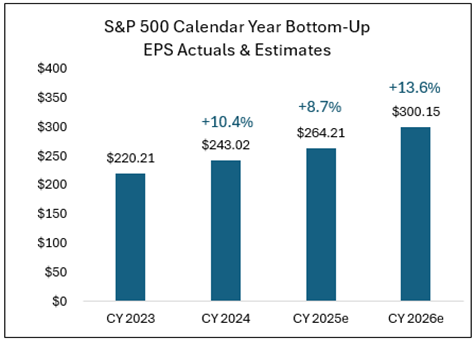
U.S. companies are also anticipated to benefit from a stable, growing U.S. economy. The aggregate estimated earnings per share (EPS) of companies in the S&P 500 Index are forecasted to grow this year and through 2026. In this environment, investors could continue to drive support for U.S. equities and other risk assets.
Markets Pricing in Fed Rate Cuts Before Year End
The U.S. Federal Reserve has remained patient on cutting the fed funds rate, waiting for signs that inflation is steadily declining toward its 2% target. Economic growth is showing signs of slowing, which can translate to lower inflation. President Trump’s final tariff policy remains an unknown factor in the Fed’s monetary policy decisions. Until tariff policy is solidified and any potential tariff impacts on the economy are known, the Fed could remain on hold with any rate cuts.
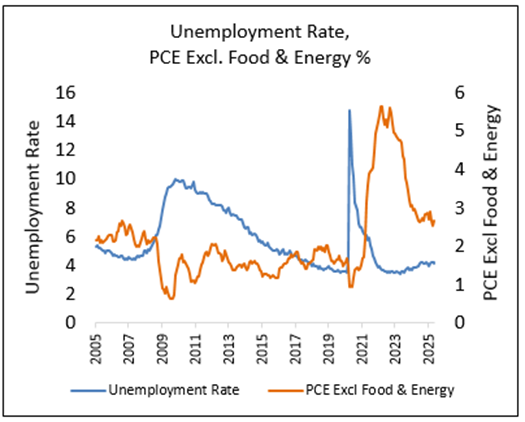
The Federal Reserve will continue to monitor inflation and unemployment data to help determine whether to cut the fed funds rate. The Personal Consumption Expenditures Excluding Food & Energy Index, a measure of inflation, was +2.7% in May, which was a slight uptick from April. This latest inflation data does not directly support significant Fed rate cuts as inflation remains above the Fed’s 2% target. The Fed may need to see inflation move closer to its 2% target before cutting rates.
The U.S. unemployment rate has also remained relatively low. The June unemployment rate measured 4.1%, which remains at the lower end of its historical range. There have been some announcements of potential workforce reductions from the federal government and technology-related companies, but the labor market has not shown widespread weakness. If the job market remains strong, the Fed may not feel pressure to adjust its current monetary policy.
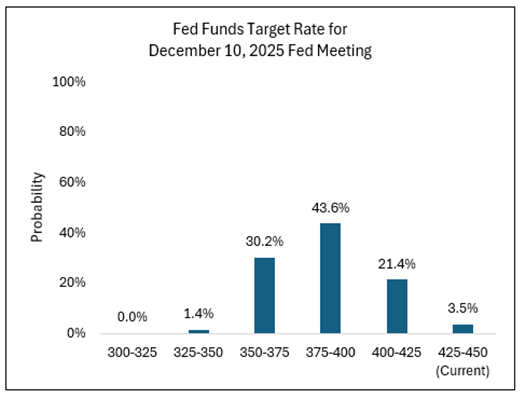
As it currently stands, the Federal Reserve has set the fed funds rate target at 4.25%-4.50%. This target range is anticipated to stay at that level until the Fed is comfortable with inflation and/or becomes uncomfortable with higher unemployment rates. The Fed has not shown a willingness to make speculative forecasts and prefers actual economic data to support its monetary policy decisions.
Unlike the Fed, investors try to anticipate monetary policy before any formal Fed decisions are announced. According to the CME FedWatch Tool, which provides some insights into investors’ views on the future fed funds rate, financial markets are pricing in a high probability that the Fed could cut the fed funds rate between 25 and 75 basis points (0.25%-0.75%) before the end of the year.
Lower interest rates can be stimulative for an economy. If the Fed returns to a stimulative monetary policy and cuts interest rates, investors may find this bullish and continue to support equities and other risk assets. Bond investors may also find rate cuts favorable as falling interest rates could drive existing bond prices higher.
Q2 Market Review
Equity Markets
Global equity markets rallied significantly in Q2 following weaker U.S. markets in Q1. As investors continue to wait for clarity on President Trump’s tariff policy, the rally in global equity markets may be reflecting greater investor confidence and potentially better days ahead.
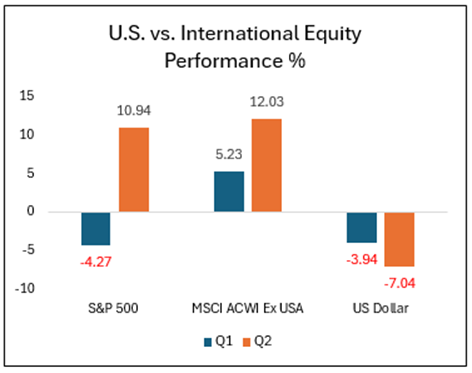
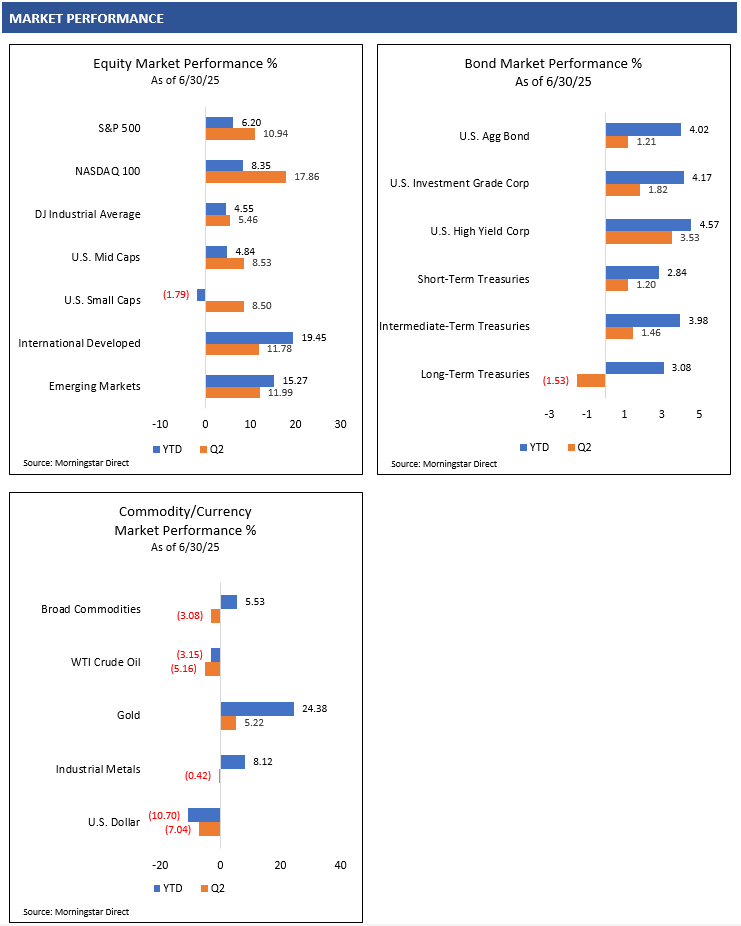
In the U.S., after a steep decline into early April, the S&P 500 and NASDAQ 100 indices both rebounded sharply and reached new highs in June. For the full second quarter, the S&P 500 Index rallied 10.94% and the NASDAQ 100 Index rallied 17.86%.1 Investor appetite for growth and artificial intelligence-related companies remained strong as the S&P 500 Growth Index was up 18.94% in the quarter and is up 8.86% YTD.1 With U.S. large cap equity indices rallying to new highs, valuations have become elevated again, a potential concern for valuation-sensitive investors.
Smaller U.S. companies’ stocks have yet to fully recover from their decline. Smaller companies can be more sensitive to economic activity and interest rates. If economic activity slows and interest rates remain elevated, smaller companies could continue to lag. If the Fed restarts interest rate cuts and President Trump’s new fiscal policies are economically stimulative, smaller and more economically-sensitive companies could benefit.
International equity markets have been strong this year. The MSCI ACWI ex USA Index, which measures both non-U.S. developed and emerging market companies’ stock performance, rallied 12.03% in Q2.1 Foreign currency appreciation against a declining U.S. dollar also benefited U.S. investors with allocations to non-U.S. equities this year.
Global investors may have been reducing some of their overweight exposure to U.S. equities, which had several years of outperformance, and increasing exposure to non-U.S. equities. Equity valuations outside of the U.S. remain at a discount relative to the U.S., which could continue to attract investors to non-U.S. equity markets.
Bond Markets
Bonds generally performed well on a total return basis in the second quarter, and income generation was a key driver. Like equities, credit-sensitive bonds also rebounded in Q2 from a challenging Q1, rewarding bond investors willing to take on additional risk in bonds.
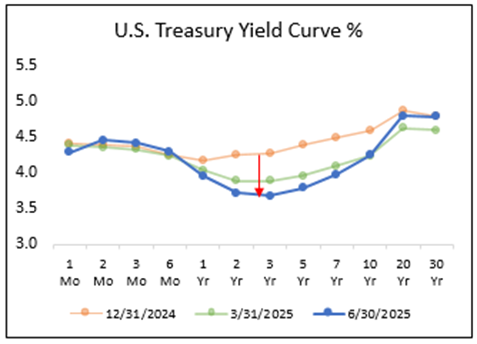
Interest rates were volatile across the yield curve in Q2, with yield shifts depending on the maturities of the bonds. Short-term rates will generally be dependent on the Fed’s monetary policy, while longer-term rates may be subject to bond investors’ views on the long-term trajectory of U.S. debt levels. This year, the biggest shifts in yields have been in the intermediate-maturity part of the yield curve, which is often tied to inflation expectations over the coming years.
In addition to bonds generating income for investors, Treasury yields have fallen across 3- to 10-year maturities, as shown in the following chart. This decline in yields may indicate investors believe that inflation will be lower in the future. As yields have declined across these maturities, their corresponding bond prices have rallied.
This combination of yield plus price appreciation has benefited bond investors this year. The Bloomberg U.S. Aggregate Bond Index, a measure of investment grade U.S. bonds, has generated a total return of 4.02% this year. Comparatively, the riskier Bloomberg U.S. High Yield Corporate Bond Index has generated a total return of 4.57%, rewarding bond investors willing to take on greater credit risk.1
Commodity Markets
Gold prices showed persistent strength in Q2, as the U.S. dollar continued to decline and geopolitical uncertainty remained elevated. Gold prices rallied over 24% this year through Q2.1
Oil prices were very volatile in the quarter. WTI Crude Oil fell below $60 per barrel in early April but spiked to over $78/bbl when the U.S. struck Iranian nuclear sites in June.12 Since then, prices have fallen back to the mid-$60s. This sharp decline could be due to the perceived reduction in the risk of Iran creating a nuclear weapon over the near term.
In addition to the tensions in the Middle East and in the Russia/Ukraine conflict, investors will continue to monitor global oil supply and demand dynamics to determine an appropriate price level for oil. Oil demand is generally tied to the health of the global economy and investors will need to monitor economic growth around the world accordingly.
Currency Markets
The U.S. Dollar Index has depreciated against other foreign currencies this year, which has added positive performance for U.S. investors with allocations to non-U.S. currency-denominated assets. Through Q2, the U.S. Dollar Index has declined 10.7% this year.1 Global investors’ desire for U.S. assets relative to non-U.S. assets could continue to drive the direction of the U.S. dollar.
SOURCES
- Morningstar Direct. Performance provided as total returns. U.S. Mid Caps is defined by the Russell Mid Cap TR USD index. U.S. Small Caps is defined by the Russell 2000 TR USD index. U.S. Growth is defined by the Russell 3000 Growth TR USD index. U.S. Value is defined by the Russell 3000 Value TR USD index. International Developed is defined by the MSCI EAFE NR USD index. Emerging Markets is defined by the MSCI Emerging Markets NR USD index. U.S. Agg Bond is defined by the Bloomberg U.S. Aggregate Bond TR USD index. U.S. Investment Grade Corp is defined by the Bloomberg U.S. Corporate Investment Grade TR USD Index. U.S. High Yield is defined by the Bloomberg High Yield Corporate TR USD index. Broad Commodities is defined by the Bloomberg Commodity TR USD index. WTI Crude Oil is defined by the Bloomberg Sub WTI Crude Oil TR USD Index. Gold is defined by the Bloomberg Sub Gold TR USD Index. Industrial Metals is defined by the Bloomberg Sub Industrial Metals TR USD Index. Short-Term Treasuries defined by the Bloomberg 1-3 Yr U.S. Treasury TR USD index. Intermediate-Term Treasuries defined by the Bloomberg Intermediate U.S. Treasury TR USD Index. Long-Term Treasuries defined by the Bloomberg Long-Term U.S. Treasury TR USD Index.
- TradingView.com. S&P 500 Index. Retrieved from https://www.tradingview.com/symbols/SPX/ on 7/3/25.
- U.S. Department of the Treasury. Fiscal Service, Federal Debt: Total Public Debt [GFDEBTN], retrieved from FRED, Federal Reserve Bank of St. Louis; https://fred.stlouisfed.org/series/GFDEBTN, July 1, 2025.
- U.S. Office of Management and Budget and Federal Reserve Bank of St. Louis, Federal Debt: Total Public Debt as Percent of Gross Domestic Product [GFDEGDQ188S], retrieved from FRED, Federal Reserve Bank of St. Louis; https://fred.stlouisfed.org/series/GFDEGDQ188S, June 30, 2025.
- U.S. Bureau of Economic Analysis. Gross Domestic Product, 1st Quarter 2025 (Third Estimate), GDP by Industry, and Corporate Profits (Revised) As of June 26, 2025. Retried from https://www.bea.gov/news/2025/gross-domestic-product-1st-quarter-2025-third-estimate-gdp-industry-and-corporate-profits.
- American Staffing Association. GDP Quarterly. As of June 30, 2025. Retrieved from https://americanstaffing.net/research/asa-data-dashboard/gdp-quarterly-projections/
- FactSet. Earnings Insight. June 27, 2025
- U.S. Bureau of Labor Statistics, Unemployment Rate [UNRATE], retrieved from FRED, Federal Reserve Bank of St. Louis; https://fred.stlouisfed.org/series/UNRATE, July 3, 2025
- U.S. Bureau of Economic Analysis, Personal Consumption Expenditures Excluding Food and Energy (Chain-Type Price Index) [PCEPILFE], retrieved from FRED, Federal Reserve Bank of St. Louis; https://fred.stlouisfed.org/series/PCEPILFE, July 3, 2025.
- CME Group. CME FedWatch Too. Retrieved from https://www.cmegroup.com/markets/interest-rates/cme-fedwatch-tool.html on July 3, 2025
- Treasury.gov. Daily Treasury Par Yield Curve Rates. Retrieved from https://home.treasury.gov/resource-center/data-chart-center/interest-rates/TextView?type=daily_treasury_yield_curve&field_tdr_date_value=2024 on July 3, 2025
- TradingView.com. WTI Crude Oil. Retrieved from https://www.tradingview.com/symbols/USOIL/

Eric Kulwicki, CFA®, CFP®, brings 20+ years of experience, currently serving as an independent investment consultant, portfolio manager, and wealth advisor for institutional and retail clients. On KulwickiInsights.com, Eric shares his timely perspectives on financial markets, investment strategies, and other financial topics. He also offers online investment education courses for beginner and intermediate investors, and coaching sessions for DIY investors seeking professional guidance.