
SUMMARY
- U.S. Equities: Maintain a slightly bullish view on U.S. equities, with recent dips providing tactical buying opportunities. Valuations, particularly for large caps, are less attractive to me at current levels, leading to an overall neutral stance from a fundamental valuation perspective. Small and mid-cap stocks maintain a slight valuation advantage. Prefer long-term exposure to higher quality, growing companies across market caps and sectors.
- International Equities: Maintain moderately bullish outlook on international equities due to their continued valuation discount compared to U.S. equities, despite recent outperformance. Opportunities are seen in both developed and emerging markets, with a preference for active management to exploit market inefficiencies. Prefer long-term exposure higher quality, growing companies across market caps, sectors and geographies.
- High Income-Generating Assets: Maintain a moderately bullish view on diversified, high income-generating assets (e.g., high yield bonds, emerging markets debt, closed-end funds). These assets can provide some value protection during equity market declines, and their absolute yields remain attractive despite credit spreads tightening back to more normalized levels.
- Commodities (Gold & Oil): Maintain a slightly bullish view on commodities overall. Gold prices could continue higher due to positive price momentum and if the declining U.S. dollar continues. Oil prices (WTI Crude) are viewed as moderately bullish at current levels ($60s), with an anticipation of higher prices over time.
- Conservative Assets (Bonds): My view on conservative assets has shifted to moderately bullish, primarily due to higher absolute yields (4.5-5%+) across investment-grade bond sectors. I prefer a duration-neutral stance as these higher yields offer attractive income and potential safety in volatile equity markets. I continue to prefer active bond managers for my allocation to bonds.
- Other (Hedges): Conservative and short-term investors could consider equity hedges following the equity rally from its lows and U.S. large cap equity valuations remain elevated. With yields at attractive levels, I prefer to utilize higher income-generating assets and bonds to reduce pure equity exposure rather than complex tactical strategies.
It’s been an interesting last few months. I hope you were prepared for the volatility.
In the midst of the market decline in March, I provided my updated views in my Outlook & Positioning piece. You can read it here…
Outlook & Positioning March 17, 2025
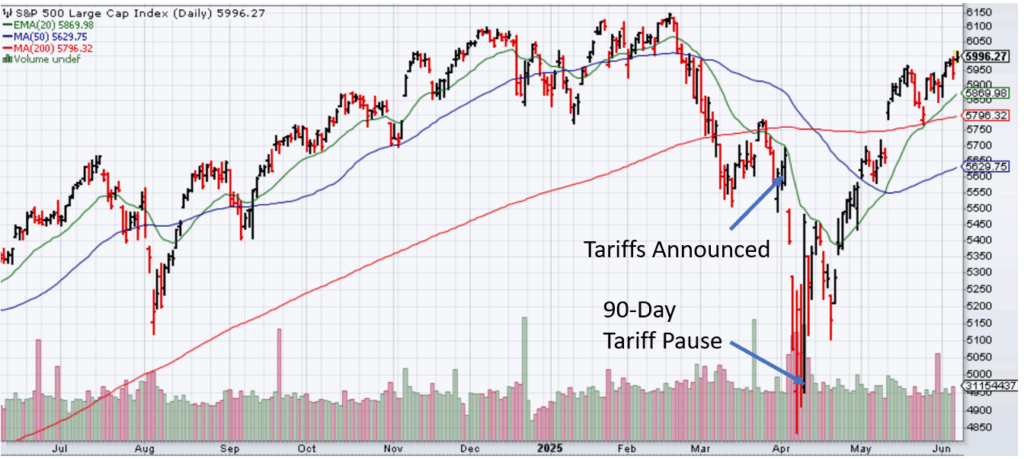
Since my March Outlook & Positioning piece, President Trump proclaimed April 2nd as “Liberation Day”, where his administration announced tariffs on various countries. The tariff levels announced were higher than originally anticipated, which spooked the financial markets. China and Europe quickly retaliated with their own tariffs against the U.S. and equity markets declined further.
In the past, President Trump has shown his affection for the stock market. Coincidentally (or maybe not), after the equity markets continued to fall after his “Liberation Day” announcement, on April 9th, President Trump announced a 90-day pause on the Liberation Day tariffs. Since then, equity markets have rallied significantly, catching many investors flat-footed and potentially underinvested after their heightened fears from the tariff announcement. The S&P 500 Index actually hit its market low on April 7th, two days prior to the tariff pause, and has rallied since then. The S&P 500 and NASDAQ 100 indices are now back close to their highs and are now in positive territory for the year.
If you are a fundamental investor trying to figure out President Trump’s tariff strategy and execution, good luck. This is a prime example of why I don’t focus on short-term macro headlines and I don’t let emotional politics impact my investing strategy. I would much rather let the markets come to me regardless of the reason and trade accordingly. That’s exactly what I did during this recent market decline and subsequent rally.
Today, we are still in the tariff pause period without significant tariff deals in place. Tariffs are now higher than they were prior to Trump taking office, but not at the extremes they were on Liberation Day. Tariffs can put upward pressure on prices, all else equal, which can slow an economy, reduce corporate profits, slow spending and weigh on risk taking.
Global economic data has shown signs of slowing. Companies in the U.S. and elsewhere that are impacted by import/export prices may be trying to get business done quickly before the tariff pause expires. This could actually give economies a short-term boost due to this short-term buying ahead of tariffs, but that could fade going forward once inventories have been stockpiled.
Market participants are also paying close attention to Congress’s work on the new tax bill, which President Trump has named the “Big, Beautiful Bill”. The bill attempts to extend components from the Tax Cut and Jobs Act of 2017 that are set to expire this year. Most people believe the tax cuts will be extended and that outcome already appears to be priced into the markets. There may be some minor additional tax cuts (no tax on tips, etc.), but the bulk of the bill is anticipated to just keep the status quo. It is not anticipated to provide the “rocket fuel” that it did when it was originally put into place in 2017 and tax rates were significantly cut. On the flip side, if Congress can’t get a bill to President Trump to sign and the tax cuts expire, the economy and markets could be negatively impacted.
Bond investors are also paying close to the “Big, Beautiful Bill”. With tax cuts extended and not enough spending cuts to cover the cost of the tax cuts, investors are becoming increasingly concerned with the U.S. federal deficit and growing debt obligations. As bond investors become increasingly concerned, longer-term Treasury yields have risen, with the 30-year Treasury yield reaching the 5% level. If the 30-year yield exceeds the 5% level, bond and equity markets could come under pressure.
In my opinion, investors should continue to anticipate volatility across equity and bond markets, with economic growth slowing (might see a quick short growth spike in Q2) and inflation remaining above the Federal Reserve’s 2% target. With equity markets close to new highs in the U.S. and parts of the international markets already at new highs, anticipating equity market declines from here remains prudent, in my opinion.
If we get another shock to the market like we did with President Trump’s “Liberation Day” tariff announcement, such as significantly weaker economic data, President Trump’s tax cuts don’t get extended, geopolitical tensions escalate or tariff uncertainty is elevated again, equity markets may give up some of these recent gains.
If we don’t get heavy shocks to the economy and market volatility is subdued, we could see global risk assets continue to move higher. An absence of bad news can be good news for financial markets.
Investor Sentiment Whipsawed
When volatility picked up in March and April, U.S. equity markets became a bit more attractive than they had been in a while. As mentioned in my last Outlook & Positioning piece on March 17th, I stated that U.S. equities looked more attractive but weren’t “pound the table cheap”. Investor fear began to pick up as equity markets continued to decline. In my March Outlook & Positioning piece, I showed the CNN Fear and Greed Index indicating a lot of investor bearishness.
At what appeared to be a period of heavy investor bearishness and market turmoil in early April, after President Trump put a pause on the tariffs, the markets quickly reversed course higher. As shown in the updated CNN Fear and Greed Index chart below, investors that bought the fear in early April and added to risk assets may have some nice gains today.
CNN Fear and Greed Index
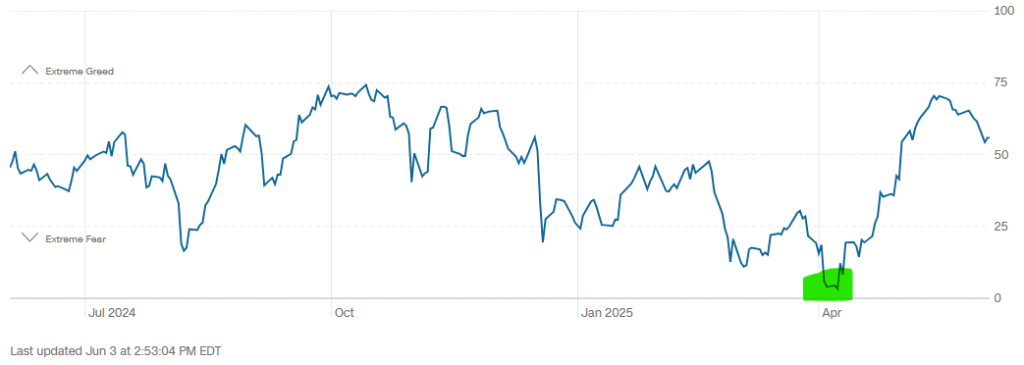
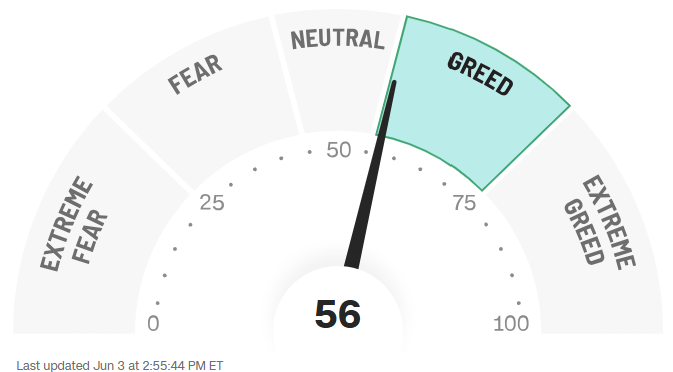
Investors have once again been reminded that markets can quickly decline and quickly rebound. With the equity markets higher from their lows, investor sentiment has improved to a more neutral level, as shown in the Fear and Greed Index data above. With investors somewhat cautious, this leaves potential upside for equity markets to continue to rally. If markets continue to rally and investors become extremely bullish (greedy), that is the time where things could turn a bit more concerning.
Quantitatively-Driven Momentum and Trend-Following Whipsawed
Investors should also be aware of short-term, quantitatively-driven momentum traders. These traders are often lumped into investor categories, such as CTAs (commodity trading advisors), managed futures, systematic traders, etc. When the markets were declining in March/April, these traders started to become more bearish, putting additional downward pressure on equity markets. You can see this happening when equity market down days become more frequent and deeper.
When President Trump announced the 90-day tariff pause, longer-term fundamental/macro investors may have switched to become more bullish. This could have caused them to add to equity exposure or cut their bearish (shorts, hedges) positioning, which causes the equity market to rally. When the equity market trend started to shift from negative (bearish) to positive (bullish), quantitatively-driven hedge funds and trend-following strategies that follow price momentum had to switch from bearish positioning (entered during the downturn) to more bullish positioning (following the rally).
If these momentum trend-following strategies need to stay disciplined and remain bullish now that the equity market trends are positive, this could also keep a floor under the markets and equity prices could continue to move higher. If equity markets stall at these levels or shift to the downside in any meaningful way, momentum trend-following strategies could start to shift their positioning to bearish. It’s at these times when you can try to anticipate extremely bearish positioning and opportunistically add to risk exposure in the downturn with the hope of a reversal from a bearish to future bullish market.
My Tactical Adjustments
As equity markets were declining, equity prices got to levels that I thought were pretty decent pitches to swing at. Starting in March, I began to swing the investment bat, adding to equity exposure to take advantage of lower prices.
As U.S. equity markets continued to decline in March and April, I increased exposure to U.S. equities as I stated that I would. I added leveraged exposure across U.S. large, mid and small caps, semiconductors and biotech equities. As I’ve stated many times, I let the market come to me and I swing the investment bat when it looks like a fat pitch down the middle. During this recent equity decline, I was really just looking for a “single” across U.S. large and mid caps, with a potential “double” across small caps, semiconductors and biotech.
As luck (or skill, you can determine that) would have it, following my increased leveraged exposure across equities, markets rallied and I started taking profits, reducing my recently added positions in leveraged U.S. large and small caps and semiconductors. I also tactically rebalanced where my positions hit levels close to, but not quite to, my sell targets, making sure I captured some profits. These tactical leveraged positions still need to reach my price targets for me to consider these trades a confirmed success. Although I’ve taken some profits, we’re not fully there yet. I need to see more upside to reach my targets and close out those positions.
I didn’t make any tactical adjustments across bonds or other higher income-generating assets over the last three months. These areas just didn’t become attractive enough for me. I didn’t consider the investment pitch to be down the middle in these areas, so I didn’t swing.
Overall, I’m back to neutral from a fundamental, valuation perspective across asset classes. I still have tactical leveraged equity positions still on, waiting for my price targets to be hit, whenever that may be. As always, I’ll be patient and let the markets come to me.
Again, investors need to be aware of how quickly volatile markets, like equities, can decline and rally. I’ve mentioned it several times throughout my posts on Kulwicki Insights, that markets do not just move based on fundamentals. Over the short-term, short-term traders, algorithms, computers, leveraged positions, etc. all can impact liquidity and market movements. Sometimes, fundamentals or events can trigger the start of these quick moves in the markets. This time around, it might have been President Trump’s tariff “Liberation Day” resulting in the market decline, and the quick subsequent pause on tariffs resulting in the market rally.
Investors need to be prepared for anything and have a plan before the markets move so you can take advantage of whatever the markets give you. That’s what I’ve done over the years and it works for me.
RISK ASSETS

I maintain a slightly bullish view on risk assets at this time.
In late March/early April, the decline in risk assets picked up speed and magnitude, which provided me an opportunity to add equity risk across my U.S. Core X and Global Unconstrained strategies. This turned out to be pretty good timing as global equity markets have rallied since then. With U.S. large cap equities close to their old highs and international equities already at new short-term highs, equities are less interesting to me at these levels.
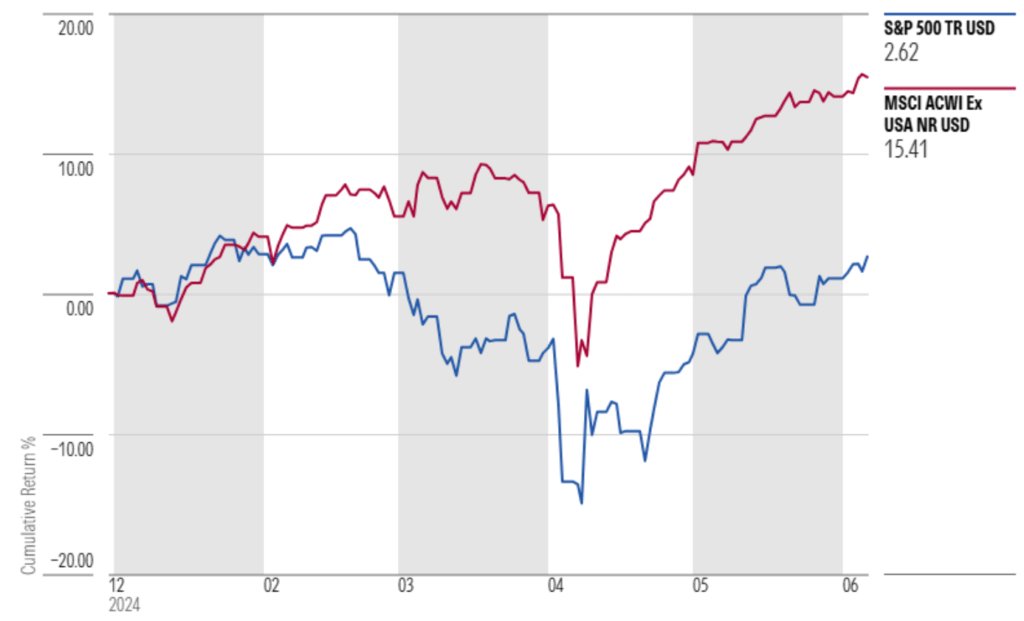
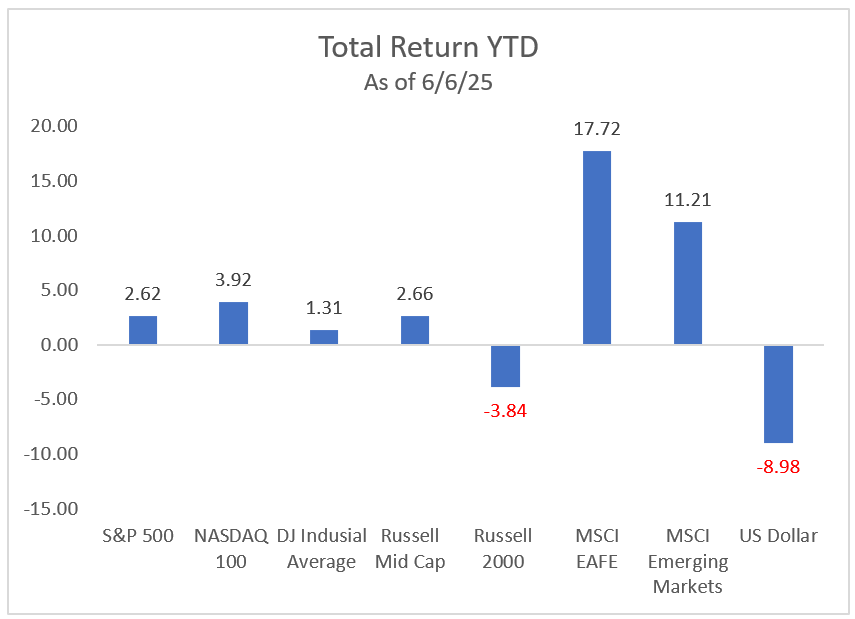
Through June 6th, the S&P 500 index is up 2.62% versus +15.41% for the MSCI ACWI Ex USA Index (measures international developed and emerging markets performance).
YTD Market Performance: U.S. vs. International
Following the decline in U.S. equity markets in March/April, valuations became a bit more attractive, but definitely not enough for me to become overly aggressive. In my opinion, U.S. equity valuations became more neutral and closer to longer-term averages, so nothing to get super excited about.
Small and mid cap stock valuations were a bit more attractive than large caps prior to the market decline, so as small/mid caps declined from their highs, I was willing to add more risk. Still not to a point for me to become aggressively positioned from a long-term fundamental perspective, but enough for me to add leveraged exposure to small and mid cap indices for a tactical trade. Now that U.S. equities have rallied from their April lows, I’ve returned to a slightly bullish fundamental view on U.S. equities.
International equities remain at a discount to U.S. equities, but that discount has tightened as international equities have outperformed U.S. equities this year. A portion of the outperformance of international equities was driven by the rally of foreign currencies relative to a declining U.S. dollar this year. Foreign currency appreciation doesn’t directly impact international equity valuations. Although foreign currencies have appreciated, foreign stock valuations are still attractive relative to U.S. equity valuations. For this reason, I remain moderately bullish on international equities at this time.
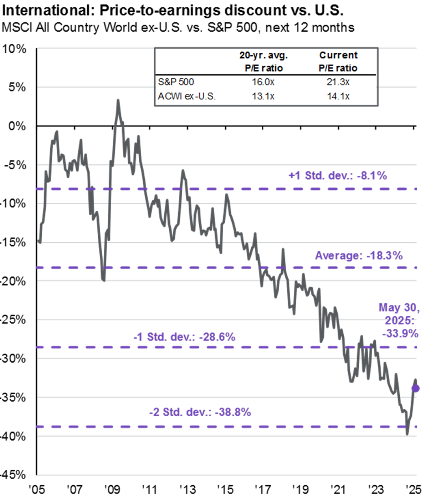
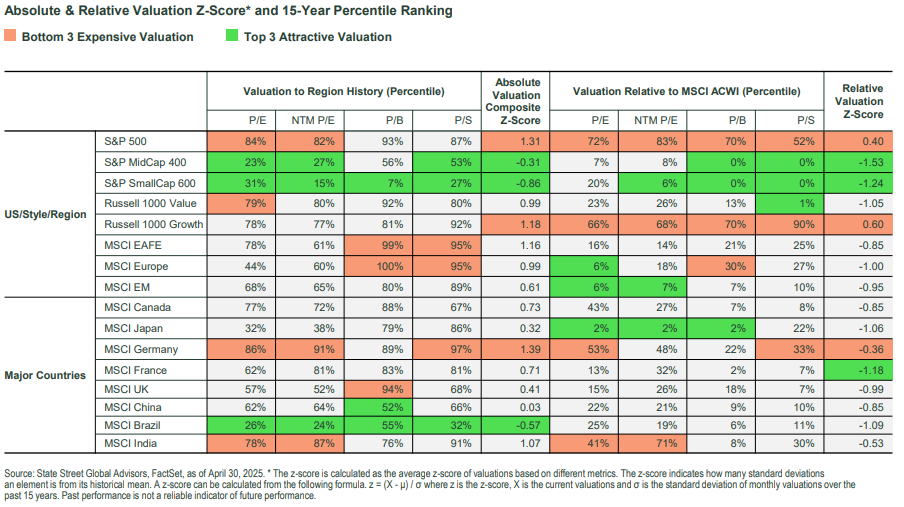
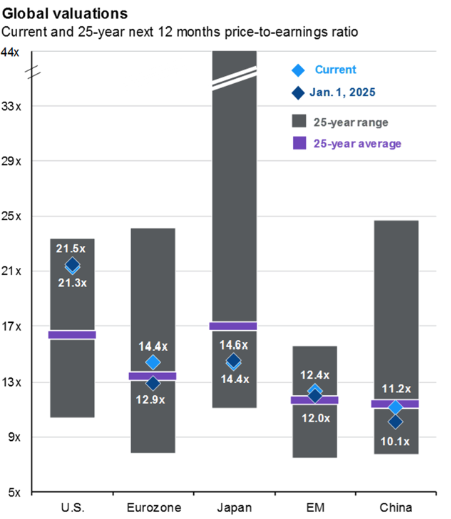
The chart below might be a bit complicated for some, but what it tells me is that across global equity markets, U.S. mid and small caps and non-U.S. equities may still have a valuation advantage to U.S. large caps. This is one factor that continues to persuade me to remain diversified across my equity allocations.
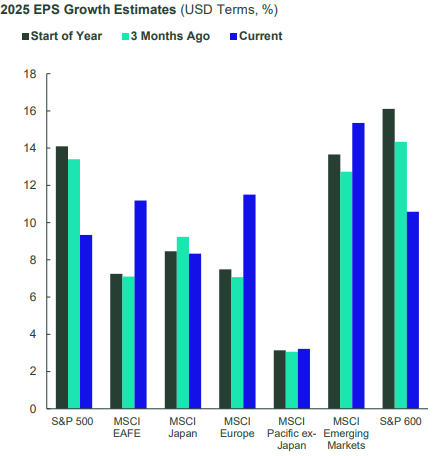
While there have been challenges, corporate earnings growth in the U.S. and across the world still appear to be positive, which may continue to support global equity markets. As indicated in the chart below, earnings growth estimates in the U.S. appear to have been coming down, while earnings estimates outside of the U.S. have been increasing. This may have provided some added support for the outperformance of international equities relative to the U.S. this year.
High income-generating assets still appear to be attractive at these levels. When equity markets declined, income-generating assets like high yield credit, emerging markets debt and real estate protected some value and outperformed pure U.S. equity markets. Credit spreads widened during the risk-off period and remain wider than the start of the year. This at least provides a decent yield in a potentially continued volatile market environment. For this reason, I continue to like exposure to diversified, income-generating assets.
In summary, while risk assets declined in March/April and I took advantage by adding to equity exposure, my views are back to where they were in my last Outlook & Positioning piece in March. I prefer to remain diversified across higher quality, growing companies, across market caps, sectors and geographies, with an allocation to diversified, higher income-generating asset classes. If markets revert back to the downside, I’ll incrementally add risk exposure as I did in March/April. If risk markets rally materially from here, I’ll consider reducing risk to my neutral targets.
U.S. EQUITIES
U.S. equity markets experienced a quick decline in March and April, which provided some opportunities to add exposure to U.S. equities. Following the subsequent rally through today, I’m only slightly bullish on U.S. equities overall.
When U.S. equity markets declined through March and April of this year, U.S. large cap valuations, as defined by the S&P 500 Index, declined to levels that I thought were starting to get close to “average” valuations. In the chart below, you’ll see that the S&P 500 Index forward 12-month price-to-earnings (P/E) ratio briefly hit around 18x earnings. This was the 10-year average P/E ratio, as indicated by the blue dotted line in the chart below. As you can see, the S&P 500 was nowhere near being considered “cheap” at 18x earnings, in my opinion.
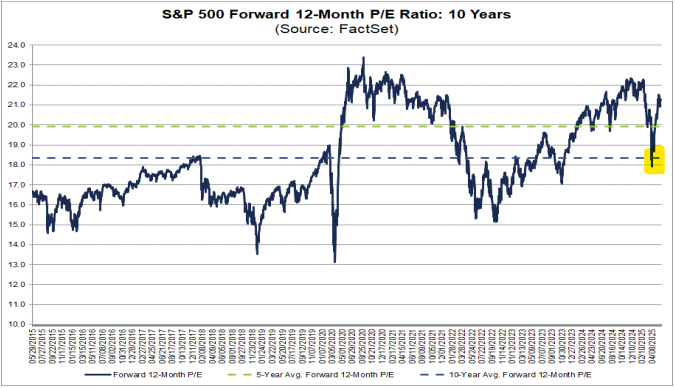
Following the rally from the market bottom in early April to where we are today, valuations have reached levels that appear elevated again. We’re back to similar valuation levels at the beginning of the year that still don’t seem that attractive to me over the short-term. At a roughly 21.5x forward P/E multiple on the S&P 500, becoming more neutral on U.S. large caps makes sense to me at this time.
As a longer-term investor, short-term extended valuation periods generally do not cause me to materially adjust my positioning on the markets. I just reset my expectations that forward market returns may be muted and volatility could be elevated. I don’t have a problem with volatility, especially if it provides quick market drawdowns that I can take advantage of, as I did in March and April this year.
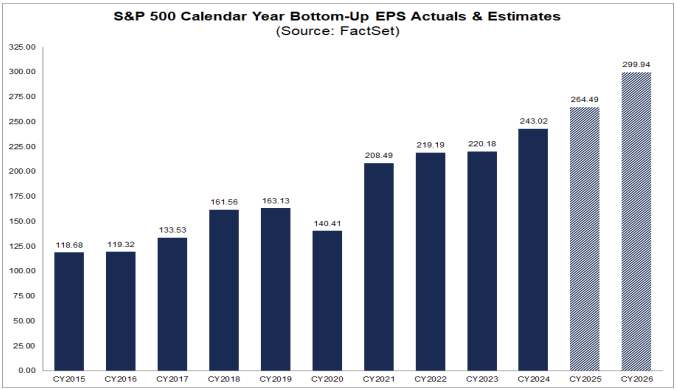
If we also look at the earnings potential of the S&P 500 Index in the chart below, we can see that from a bottom-up perspective, the aggregate companies in the S&P 500 are forecasted to generate higher earnings this year and next year. Earnings growth forecasts often start high, then fall over time as future optimism fades, but if earnings can avoid a significant decline, investors may continue to support U.S. companies and the equity markets. In this scenario, longer-term investors may continue to buy the dip in the markets, taking advantage of any short-term market dislocations. This is what I am prepared and positioned for at this time
Market Technicals
If we look at U.S. equity market technicals, we are now looking at prior market highs as resistance. This could be a level where shorter-term traders take some profits, particularly if they added to equities during the market decline. I will personally be reducing risk as equity markets reach their prior highs.
If U.S. equities chop around for a while at these levels without a material decline, rising moving averages and trend lines could help push equity markets higher. If the S&P 500 and NASDAQ 100 indices can break above their old highs, momentum traders could quickly push equities for another leg higher. This could result in enough pain for fundamentally-driven investors that continue to see economic weakness and challenges to corporate earnings. If the markets continue to move higher, investors could experience an emotional “fear of missing out” (FOMO) and reluctantly get back into the equity markets, pushing equities even higher.
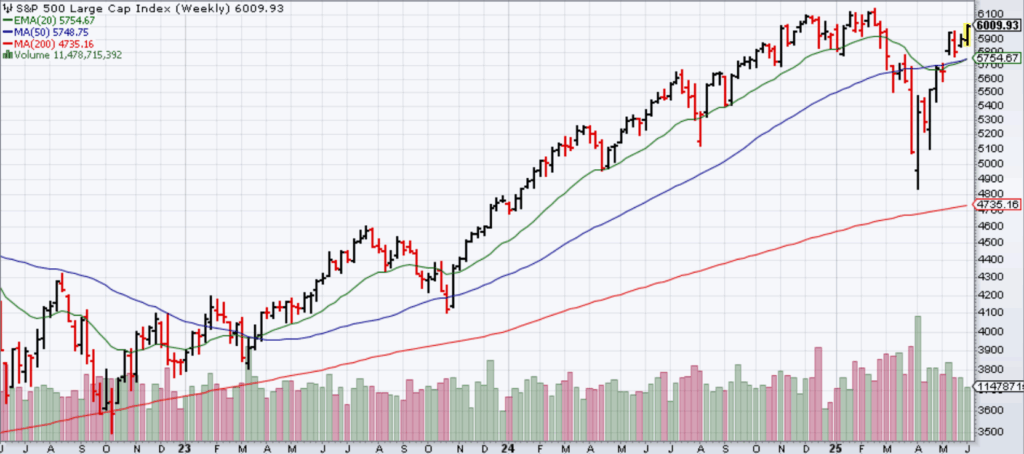
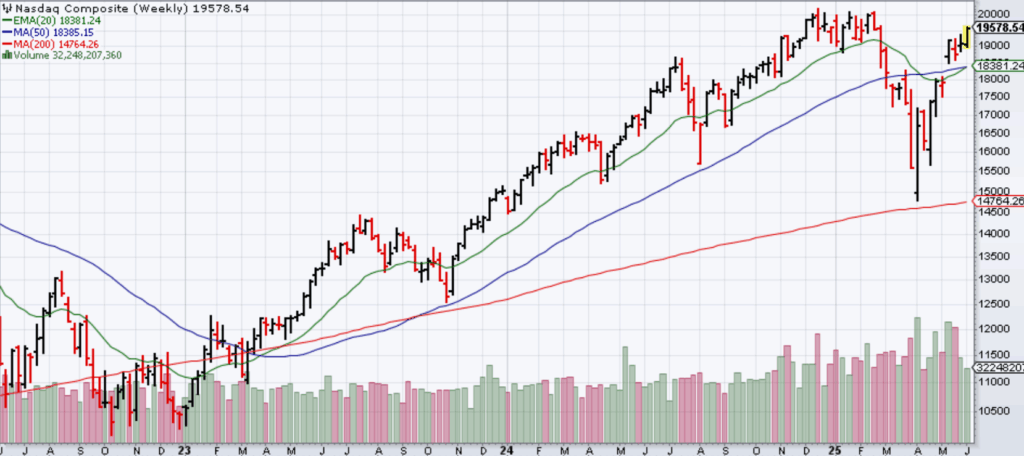
As shown in the charts for the S&P 500 and NASDAQ 100 indices, both are roughly 2% from their highs after rallying from their lows. The S&P 500 has rallied over 20% from its lows and the NASDAQ 100 has rallied over 30% from its lows. In my March Outlook & Positioning piece, I stated that the 200-week moving average (red line in the charts below) could act as support to the markets, and that’s what happened for the S&P 500 and NASDAQ 100 indices. A shorter-term trader using moving averages for trade indicators could have taken advantage.
S&P 500 Index
NASDAQ 100 Index
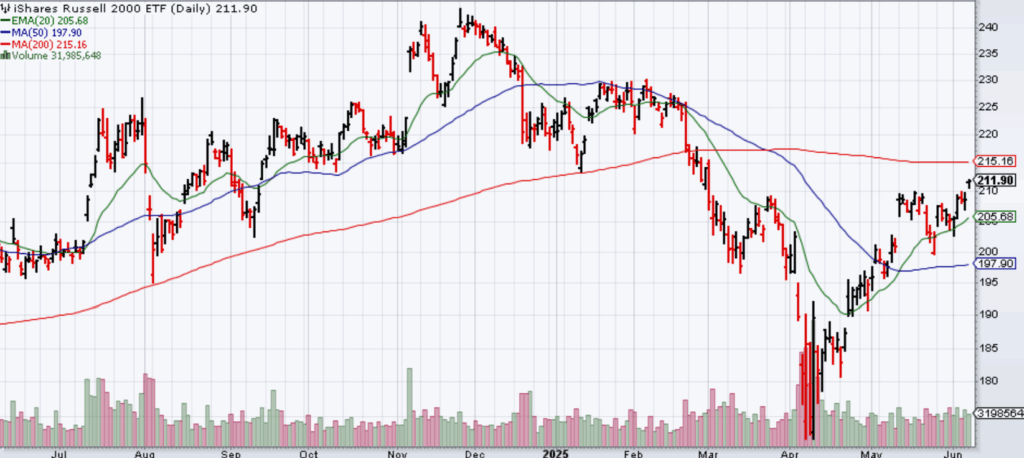
Russell 2000 Index (small caps)
U.S. small caps experienced a deeper selloff. The Russell 2000 Index (a small cap index) declined below its 200-week moving average. Small caps haven’t reached close to their highs like the S&P 500 and NASDAQ 100 indices, so there may be room for continued upside from here.
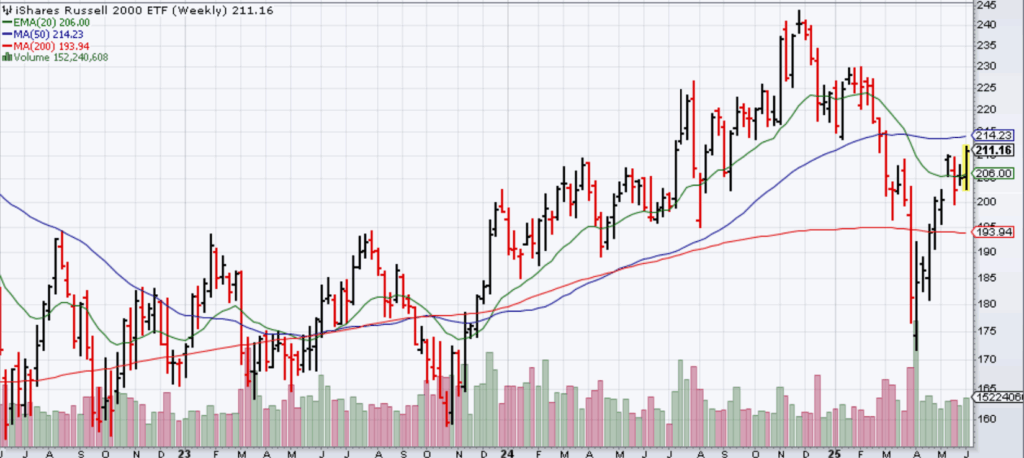
Looking at the daily chart below, if small caps can get above the 200-day moving average (red line), it might have some ability to accelerate higher and potentially outperform large caps, at least over a short period.
If U.S. equity markets continue to rally and reach new highs across market cap, I will reduce my overweight leveraged positions back to neutral in my U.S. Core X strategy. This will bring me back to the positioning I had at the start of the year. If semiconductors and small cap biotech continue to rally from the lows to my targets, I will reduce and/or eliminate those positions as well in my Global Unconstrained strategy, ultimately de-risking my overall U.S. equity exposures across strategies.
FOREIGN EQUITIES

I have been moderately bullish on international equities for some time. As in the U.S. equity markets, I prefer diversified exposure to higher quality, growing companies, across market caps, sectors and geographies. At least this year, my moderately bullish view on foreign equities has been beneficial.
International markets performed well this year relative to U.S. equity markets. Through June 6th, the MSCI EAFE Index (measures international developed countries’ stocks) was up over 17% YTD, and the MSCI Emerging Markets Index was up over 11% YTD. Not only did international companies’ stocks perform well, foreign currencies also appreciated against the U.S. dollar. The U.S. Dollar Index declined almost 9% YTD. A declining U.S. dollar can increase returns of foreign investments held by U.S investors. The combination of international equities rallying and the U.S. dollar declining was a strong tailwind for investors in foreign equities.
The outperformance of international equities is what I believed could happen due to the valuation discounts in international equities relative to U.S. equities. It was nice to see this play out this year, at least so far. We’ll see what happens from here.
Although foreign equities have materially outperformed U.S. equities this year, valuations in international developed and emerging markets remain attractive relative to those in the U.S. I believe that there is renewed interest in Europe and Asia to try to solidify their own countries and regions, which may result in increased government spending and more favorable local business environments. If that is the case, global capital may continue to try to seek investment opportunities outside of the U.S., particularly for those who may have been materially overweight in their exposure to the U.S.
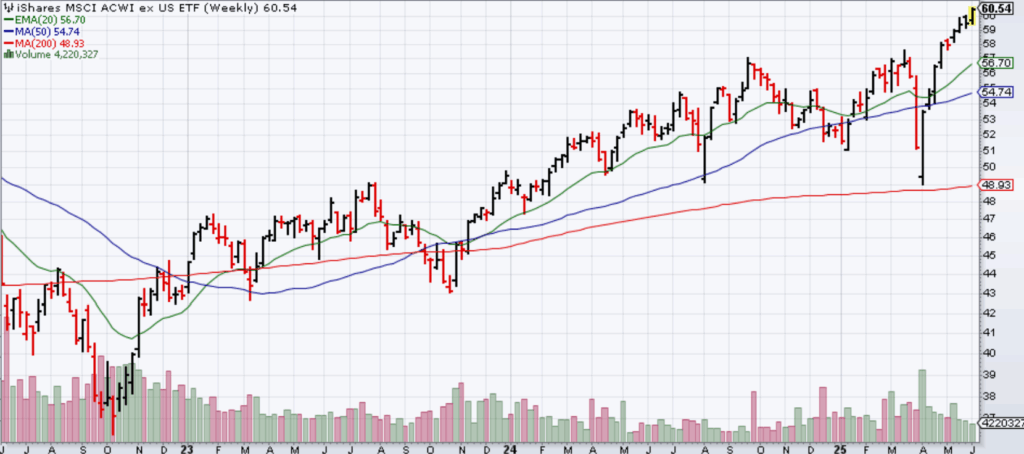
If we look at how international developed and emerging markets have performed by looking at the MSCI ACWI ex USA index (by iShares ETF proxy), you can see the index declined to its 200-week moving average (red line) and has since rallied to new highs and continues to push higher. Yes, international equity markets can also bounce off of squiggly lines.
In my Global Unconstrained strategy, I maintain leveraged positions in Chinese equities and diversified emerging markets. Trading the volatility in Chinese equities has been beneficial and a longer-term position in diversified emerging markets remains interesting to me.
Due to what appears to be relatively attractive valuations in international equity markets, with the potential for continued global support for non-U.S. equity investments, I continue to be moderately bullish on foreign equities at this time. I continue to prefer investing in higher quality, growing companies across market cap and geography, both in developed and emerging foreign markets. I still prefer to use active managers for international equity exposure, particularly across global equity managers that can shift across U.S. / non-U.S. markets, and in emerging markets and international small caps, where there can be increased market inefficiencies that active managers can exploit.
HIGH INCOME
I remain moderately bullish on diversified, high income-generating assets at this time.
Coming into the year and being less interested in U.S. large cap equities due to extended valuations, I had a moderately bullish view on diversified, higher income-generating assets. I believed this exposure could potentially hold up a bit better during an equity market decline and could provide income if we get into a period of sustained volatility without much equity upside.
As equity markets declined in March and April, higher income-generating assets did help protect some value as hoped.
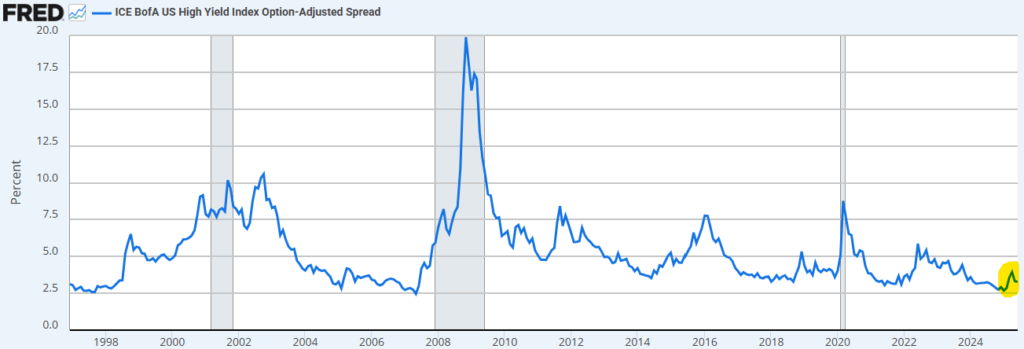
I had a concern with tight credit spreads in U.S. high yield bonds, which were very tight relative to history. Investors weren’t receiving enough added yield (credit spread) over Treasuries to make it overly attractive. While spreads weren’t attractive in and of themselves, the high income generation was still attractive to me relative to pure U.S. equities, thus my preference for diversification and exposure to higher income-generating asset classes.
As risk assets declined in March and April, credit spreads finally started to widen. While these wider credit spreads made U.S. high yield bonds more attractive than they had been, credit spreads were just getting back to more “normalized” levels. So from my perspective, it really wasn’t a pound the table and buy moment. Just like the equity markets weren’t a pound the table and buy moment.
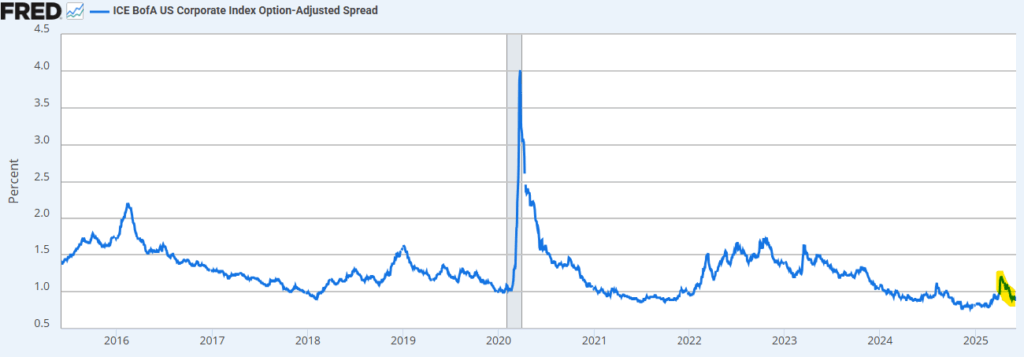
Looking at credit spreads from March to now as shown in the chart below, the credit spread widening was barely a blip relative to history. History has shown that credit spreads can get much wider in weaker market environments. Using the chart below, the higher the line goes, the more yield you receive relative to similar maturity Treasury bonds. Without a big spike in credit spreads, there was really no reason for me to get overly excited to significantly add risk exposure to U.S. high yield bonds.
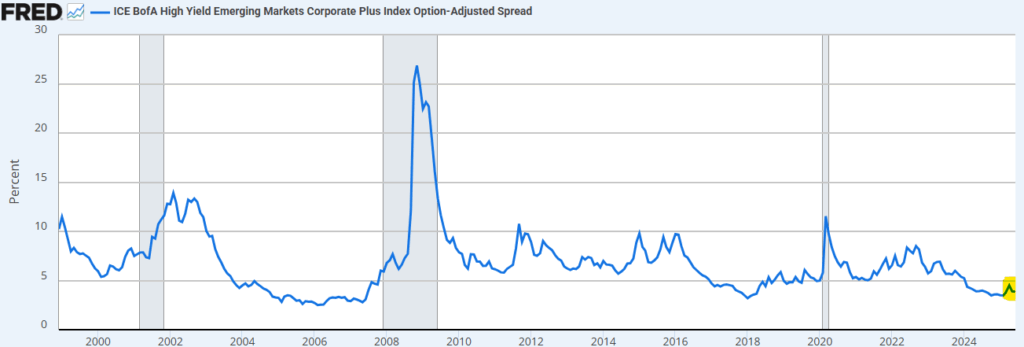
If we go outside of the U.S. and look at emerging markets corporate bond spreads, it’s the same story. Credit spreads didn’t widen much, thus no reason to add a ton of risk here either.
With credit spreads not widening to attractive levels, closed-end funds, which often use leverage when investing in credit-sensitive bonds, are not attractively valued as a group either. Closed-end funds’ market price discounts to their net asset values (NAVs) did widen during the risk-off period, but not to a level where I wanted to increase exposure to closed-end funds, so I maintained my exposures there. I need to see closed-end fund discounts widen to 12-15% and credit spreads widen much further before I’d consider adding a meaningful overweight to closed-end funds.
Although credit spreads and closed-end fund discounts are back to being pretty tight again, the absolute yields and total return (yield-to-worst) potential of credit-sensitive bonds remains attractive. With added leverage in closed-end funds, the total return potential of credit-sensitive bonds and credit-sensitive closed-end funds appears attractive.
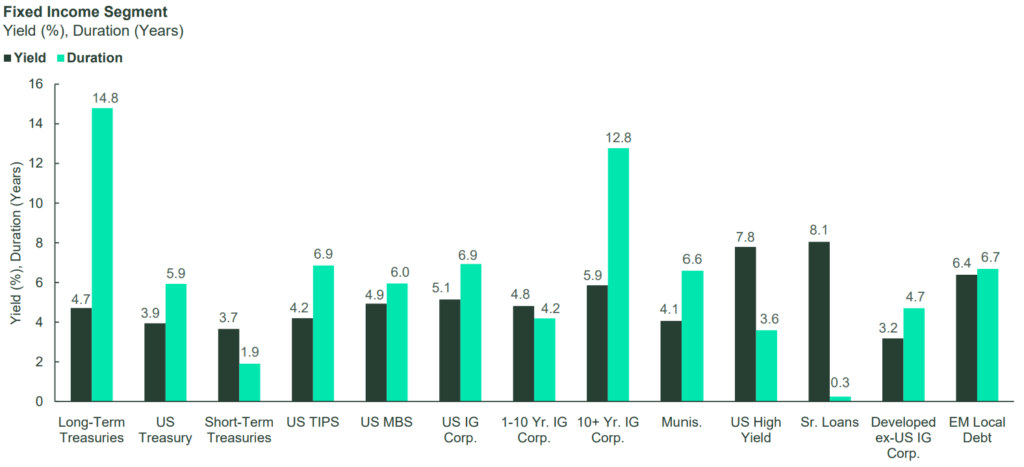
As shown in the graph below, with yields above 5% across many bond sectors, more aggressive credit-sensitive bonds can provide attractive income and potential diversification to pure equity exposure. In a flat, choppy equity market, income generation can provide some added support.
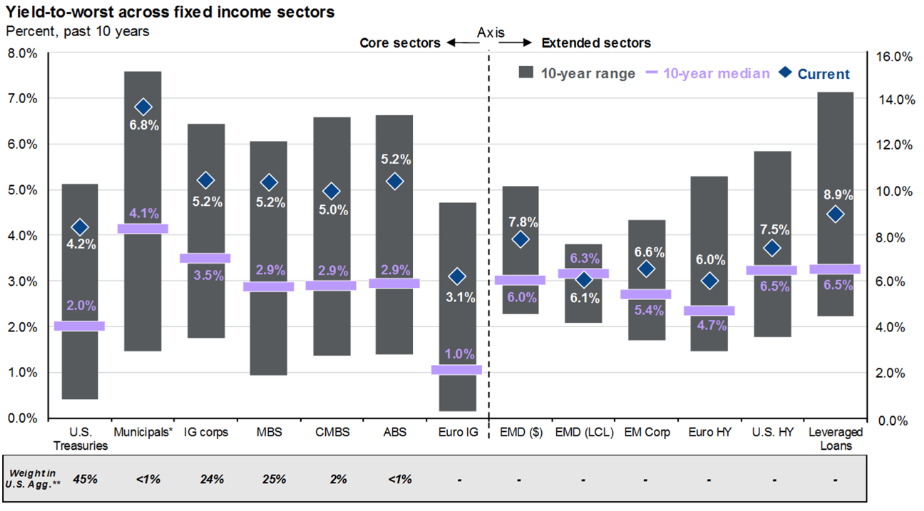
While credit spreads and closed-end fund discounts have tightened again, I still like the potential yield of 6%+ across a diversified allocation to higher income-generating assets. This includes high yield bonds, emerging markets debt, closed end funds, option income strategies and tactical income strategies. If risk assets remain volatile, and U.S. equity valuations still aren’t that attractive, having diversified exposure to higher income-generating assets makes sense to me.
COMMODITIES
I remain slightly bullish on commodities overall.
Gold
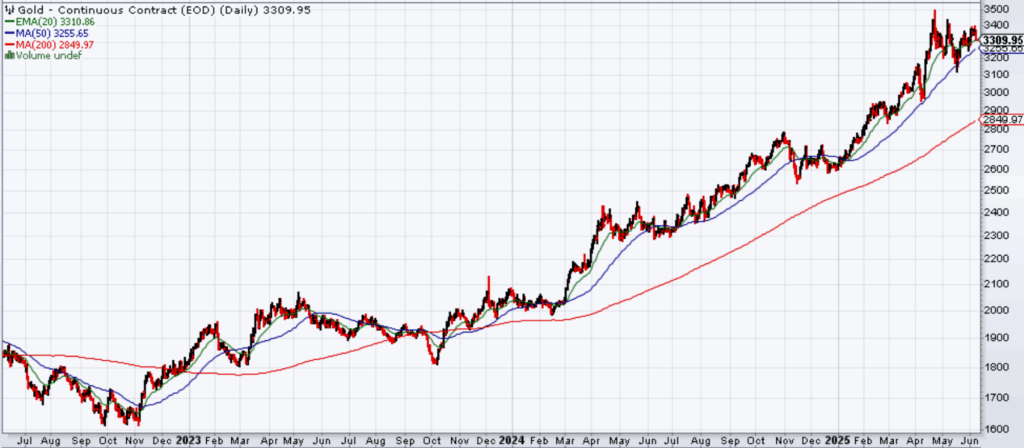
Gold prices continue to move higher, driven by price momentum and a declining U.S. dollar. When asset classes have price trend persistence, like gold has seen over the last year and a half, the path of least resistance is to remain on that path.
As you can see in the chart below, the trend of gold prices has been on a relatively smooth path higher since the beginning of 2024. Gold can continue to move higher from here, just based on positive price trends. Ignoring any potential fundamental drivers for gold (inflation, the U.S. dollar, interest rates, etc.) and just based on price trends, unless gold prices break materially and sustainably below the 200-day moving average (red line), the current path of least resistance for gold prices remains higher.
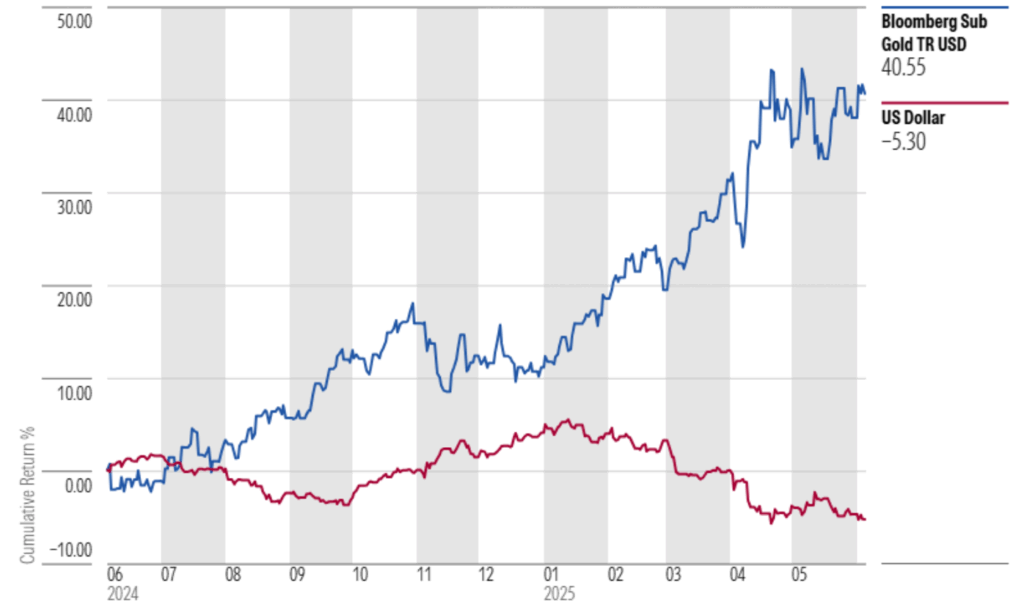
When we look at gold from a fundamental perspective, gold is often used as a hedge against a declining U.S. dollar. As you can see in the chart below, gold prices really started to take off higher as the U.S. dollar peaked in January and declined from there. If we see the U.S. dollar stabilize or rally from these levels, gold may experience some downside pressure.
U.S. Dollar vs. Gold Prices
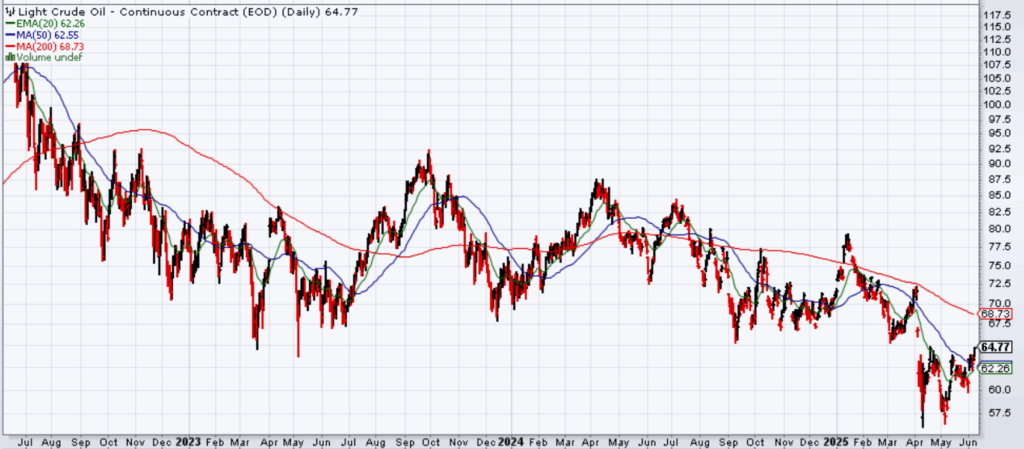
WTI Crude Oil
I’m a bit more bullish on oil prices at these levels. As I’ve previously stated on Kulwicki Insights, WTI Crude Oil has generally traded in a range of $60-$90. WTI Crude now trades at around $65. As you can see in the chart below, WTI Crude Oil traded briefly below $60, but bounced higher from there. With WTI Crude in the low- to mid- $60s, I’m moderately bullish on WTI Crude, anticipating that prices will be higher than current levels at some point in the future.
CONSERVATIVE ASSETS
With absolute yields moving higher since March at 4.5-5%+ across a number of investment grade bond sectors, I have increased my view on conservative assets to moderately bullish.
As consistently stated, I would be more bullish on interest rate-sensitive bonds with yields closer to the 4.5%-5% mark. I believe the yield curve could trade at between 3.5% and 5% for the foreseeable future. Within that range, I am generally more bullish on duration closer to 5% yields and less bullish at yields closer to 3.5%.
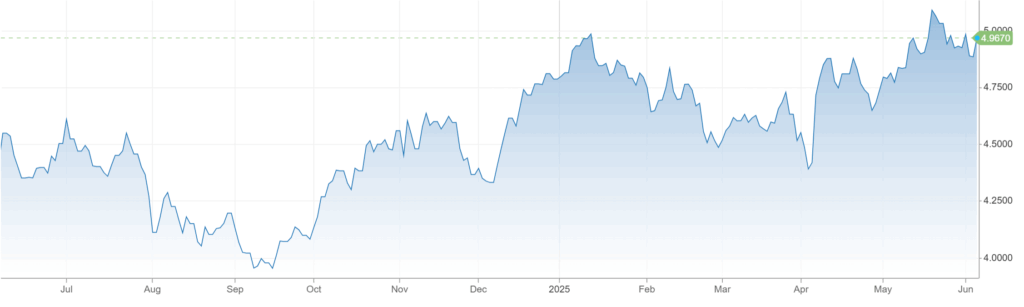
With increased concerns on the level of U.S. debt, 30-year Treasury bonds traded above 5%, as shown in the chart below. In my opinion, if the 30-year Treasury yield materially exceeds that, it could cause risk assets to decline. If investors want to seek safety in a declining equity market, Treasury bonds yielding 5%+ could attract investors, which could ultimately cause bonds to rally and bond yields to decline.
30-Year Treasury Bond Yield
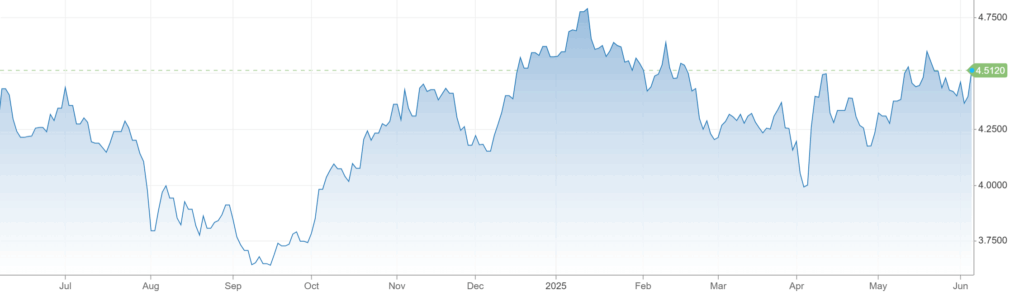
The U.S. 10-year Treasury hasn’t quite reached the 5% yield mark, potentially due to the anticipation of an economic slowdown and the possibility of the Federal Reserve cutting the fed funds rate in the future.
U.S. 10-Year Treasury Yield
When the 30-year Treasury yield exceeded 5%, the 10-year Treasury yield exceeded 4.5% and credit spreads widened to a more normalized level, I changed to a moderately bullish view on conservative assets and currently maintain that view.
There are cross currents impacting interest rates, including a potentially slowing economy over the next 12 months, the Fed potentially cutting interest rates, and U.S. debt concerns due to persistent federal deficits. I think we’ll have lower interest rates from here at some point and am willing to be moderately bullish on conservative assets overall at this point. I prefer to take a duration neutral stance relative to bond benchmarks, without a material overweight or underweight duration position, unless the yield curve moves significantly one way or the other from current levels.
I prefer to remain diversified across my bond allocation, across sectors, duration and credit quality. I think there are enough opportunities for active bond managers to take advantage of in this environment. The current higher yield environment generates attractive income, which helps even if volatility persists.
U.S. GOVERNMENT BONDS
I remain slightly bullish on U.S. government bonds at these levels.
Intermediate-term Treasuries with yields around 4.5% level are attractive, particularly if inflation can stay below 3% and trend towards the 2% level over time. I prefer to be diversified across government bonds, allocated to not only Treasuries but also to higher-yielding agency and government-backed mortgage bonds as well.
Rather than a material allocation to government bonds, my preference remains to be overweight diversified investment grade credit through the utilization of active bond managers.
U.S. INVESTMENT GRADE CREDIT
Investment grade credit spreads widened during the risk-off period in March/April, but really not wide enough for me to add credit risk to my conservative allocations. At that time, investment credit spreads really only got to what I would consider to be “normalized” levels. Since then, investment grade credit spreads have tightened to levels that are less attractive. For this reason, I remain slightly bullish on U.S. investment grade credit at this time.
I continue to prefer allocating to actively managed bond strategies, with investment managers that have the flexibility to allocate across bond sectors, credit quality and duration. If at some point credit spreads widen to more attractive levels, I would become increasingly bullish and add exposure to more credit-sensitive bond managers at that time.
I think we could continue to experience volatile bond markets as economic and political uncertainty persists. If interest rates rise due to increased U.S. debt fears and credit spreads widen due to a weaker economic environment, that could be a great time for me to add credit risk to portfolios. As always, I’ll remain patient and let the market come to me.
OTHER
I use this section to talk about other potential strategies, generally whether or not hedges are needed on asset classes.
I remain slightly bullish on other, non-traditional investment strategies at this time.
I really don’t have any change of view here. With U.S. equities getting close to their old highs, equity and credit asset valuations appear stretched again, and economic and political uncertainty remains, having some sort of a hedge on risk assets makes sense. For this reason, I remain slightly bullish on hedged strategies at this time.
If using alternative strategies to hedge equity risk, I prefer structured hedged equity strategies, rather than other tactical strategies that are less predictable, such as trend-following strategies.
Across the bond markets, I don’t have a need to hedge duration or credit risk at these levels. I’m willing to take on the volatility from credit exposure and don’t want to spend capital on credit hedges at these yield levels.
With bond yields back to higher absolute levels, I continue to prefer diversified exposure to credit-sensitive bonds to help reduce equity exposure, rather than relying on overly complex hedging strategies. Since different hedging strategies might work differently in different market environments, I prefer the consistency of bonds with defined income and yield-to-worst metrics driving my anticipated returns.

Eric Kulwicki, CFA®, CFP®, brings 20+ years of experience, currently serving as an independent investment consultant, portfolio manager, and wealth advisor for institutional and retail clients. On KulwickiInsights.com, Eric shares his timely perspectives on financial markets, investment strategies, and other financial topics. He also offers online investment education courses for beginner and intermediate investors, and coaching sessions for DIY investors seeking professional guidance.